The U.S. stock market as measured by the S&P 500 has soared over 300% since the trough reached in March, 2009 at the peak of the Global Financial Crisis. The current bull market is one of the longest in history and valuations remain elevated according to an article by Manning & Napier Advisors. They predict that the US market has less upside potential moving forward.
The chart below shows the forward P/E ratio of S&P 500 from June 2007 thru June 2017:
Click to enlarge
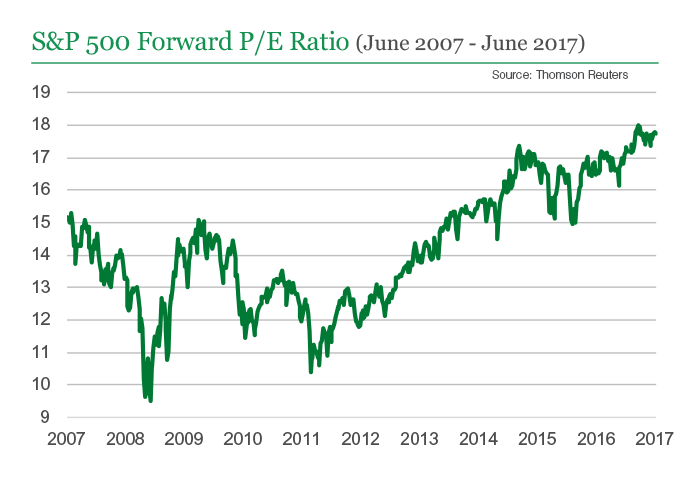
Source: July 2017 Perspective, Manning & Napier Advisors
So what should an investor do given the high valuations of US stocks?
While forecasting what the market will do in the future is especially difficult there are many things that an individual investor can do. For instance, instead of worrying about things beyond their control they can focus on things that are under their control. Listed below are some of the strategies an investor can consider:
- Diversify across asset classes and regions/countries. No country’s market is the top market each year. So better to allocate assets across countries.
- Certain sectors of the US market such as the tech sector are in bubble territory now. Investors may want to cautious of these sectors. The WSJ and other financial media is full of frontpage articles how Silicon Valley companies are changing the world and how their growth is almost infinite.
- Investors committing new money into the market may invest in phases by waiting for pullbacks and picking up stocks cheaper than investing in one shot.
- This is not the time to be complacent and go with the crowd. Instead investors have to create a watchlist of stocks and wait for lower levels to deploy new capital.
- Stay away from IPOs. Most of them are overpriced and end up losing money for retail investors.
- Investors also have to be prepared for lower returns moving forward and also be ready for a correction in the equity markets. So this means if they are overweight in one sector or stock and have high unrealized gains, now may be the time to take some profits off the table and wait for opportunities.
- Canadian market looks attractive at current levels compared to other developed markets. Hence investors can consider adding stocks from up north selectively.
Related ETF:
- SPDR S&P500 ETF Trust (SPY)
Disclosure: No Positions