Income Inequality in Emerging And Developed Countries: Chart

Income inequality is rising in many countries of the world especially in emerging countries and some developed countries. The Gini coefficient is one way to measure inequality. The higher the number the more inequal a country is. The chart below shows income inequality in emerging and select developed countries:

Click to enlarge

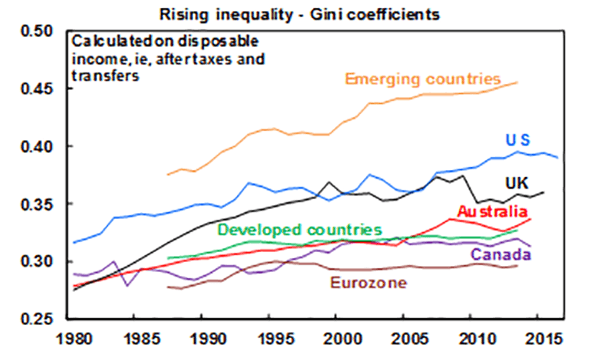
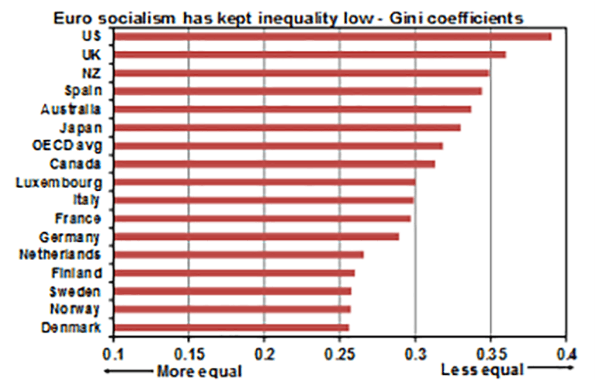
Inequality is a major issue in emerging countries due to corruption and other factors.  Among advanced countries income inequality is the highest in the US and low in the Eurozone countries. This is because the US is a capitalist country where capital rules and the winner take all philosophy is followed. Eurozone countries on the other hand follow Socialism where the economy is designed towards social welfare rather than capital accumulation by some at all costs.

Click to enlarge

Source: Inequality- is it increasing? What’s driving it? And what it means for economic growth and investors, AMP Capital.

According to the above charts, the US is just one step above emerging countries from an inequality perspective. Whether rising income inequality is good or bad for a country remains to be seen.

Time in the Market is More Critical Than Timing the Market

One of the important investment concepts that investors have to always remember is the futility of trying to time the market. It is never a wise strategy to time the market – which simply means selling out at market tops and buying back at market lows and repeating the process over and over. Since this process involves predicting the future it is always destined to fail. There is no way to determine the market peak as well as market troughs. Hence instead of trying to time the markets investors are better off just being in the market with a long-term horizon. Or to put it another way time in the market is more important than timing the market. During the Global Financial Crisis(GFC) many investors lost out when they sold out at the peak of the crisis and failed to get back in when markets roared back strongly.

I have written articles before in timing the market using the example of US markets. In a recent article, James Norton, senior investment planner at Vanguard UK discussed about the importance of time in the market.The chart below shows that the return on the FTSE All-Share Index was cut in half when an investor misses the 10 best days of the market. The FTSE All-Share Index represents 98-99% of UK market capitalization and is the aggregation of the FTSE 100, FTSE 250 and FTSE Small Cap Indexes. So its a better representation of the British equity market than the FTSE 100.

Click to enlarge


Source: Time in the markets, not timing the market, Vanguard UK

Related ETFs:

  • iShares MSCI United Kingdom Index (EWU)

Disclosure: No Positions

The Big Five Canadian Banks Are Great Dividend Growers

The big five Canadian banks – Bank of Nova Scotia (BNS), Bank of Montreal (BMO), Canadian Imperial Bank of Commerce (CM), Royal Bank of Canada (RY) and Toronto-Dominion Bank (TD) –  are excellent picks for income investors. They are slow but steady winners in the long-term especially with growing dividends. According to an article at Bloomberg, these five banks have increased their dividends on an average by 64% since 2008.

Click to enlarge


Source: Five charts that show Canadian stocks could rise from the dead, Bloomberg via Financial Post

Disclosure: Long all five banks

Australian Stocks’ Growth and Major Events Since 1900

In an article yesterday we looked at how Australian stocks beat cash and bond since 1900. During this period there we many major political and economic events that shook Australia and the world. In general, investors have always something to worry about. For example, today it is North Korea. Just a while ago it was the US election drama.Before that many years of European debt crisis drama and so forth.

Despite multiple major events since 1900 Australian stocks continued to move upward as shown in the All Ordinaries share price index  below:

Click to enlarge

Source: Five great charts on investing, AMP Capital

For investors, there is always something to worry about. In the past stocks have overcome the wall of worry to earn higher returns than cash and bonds.

The key takeaway is that investors cannot wait for an ideal environment for investing in the equity market. There will always be some negative events happening – whether it is fluctuating oil prices, wars or simply threat of wars, recessions, etc. Instead of worrying too much about events that are beyond their control investors should focus on the long-term goal and accumulate assets at cheaper prices when the opportunity presents itself.

The Power of Compounding: An Australian Example

Albert Einstein said “Compound interest is the eighth wonder of the world”. Compounding of interest over many years will lead to multiplication of the original principal or capital many times. The following example shows the power of compounding for various Australian asset classes:

Click to enlarge


Source: Five great charts on investing, AMP Capital

From the above article:

The chart shows the value of $1 invested in various Australian assets in 1900 allowing for the reinvestment of dividends and interest along the way. That $1 would have grown to $231 if invested in cash, to $850 if invested in bonds and to $485,815 if invested in shares. While the average return since 1900 is only double that in shares relative to bonds, the huge difference between the two at the end owes to the impact of compounding or earning returns on top of returns. So any interest or return earned in one period is added to the original investment so that it all earns a return in the next period. And so on.

Similar to most other developed markets, stocks beat cash and bonds in Australia also from a return perspective. It is unlikely that one would stocks for such a long period of time such as over 100 years though. Most people invest or save for a particular goal such as retirement or children’s education. Despite this point, the above chart clearly shows that investing in stocks yields a better return than cash or bonds.