US Top Marginal Income Tax Rates 1913 To 2017: For Individuals vs. Corporations

The graph below shows the US top marginal individual income tax rate against top marginal corporate tax rates. The tax rates haven’t changed in over 30 years.

The current administration is planning to reduce the top rate for individuals from 39.6% to 35% and for corporations from 35% to 20%.

Click to enlarge


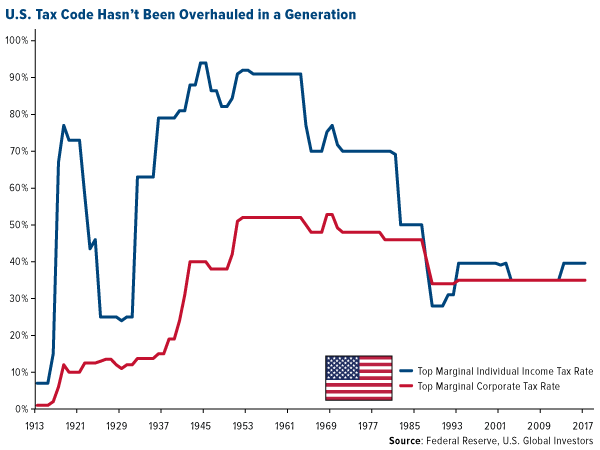
Source: This Could Be a No-Brainer Gold Buying Opportunity by Frank Homes, US Global Investors

The income tax rate for individuals have always been higher than for corporations for the most part.

The Impact of Central Bank Actions on US and European Stocks

US stocks have soared since the Global Financial Crisis(GFC) of 2008-09. The multi-year bull year market continues to move forward breaking records. Though many experts have been calling for a correction for many months now stocks are going up proving them incorrect. European stocks on the other hand have langished for years until this year. Despite having similar economic systems and institutions like those in the US, developed European countries dithered for years going thru one crisis after another. As a result European economic growth stagnated and stocks performed miserably. According to an article published by Oppenheimer Funds back in June, the ECB started implementing real liquidity measures only in 2015 whereas the US Federal Reserve took swift action all the way back in 2008. The following chart shows the performance of US and European stocks since 2008 thru March this year:

Click to enlarge


Source: Welcome Back, Europe by George R. Evans, CFA and Brian Landy, CFA at Oppenheimer Funds

The key takeaway is that Central Banks have the power to lift asset prices by pumping liquidity into the markets. But how quickly they implement policies is important. In this regard Americans were far ahead of Europeans. Since the EU is made up of many countries decisions take much longer and the ECB has to consider all member nations’ interests. Then again the point of the EU and ECB is to act as one voice and not as individual countries. This is where Europeans failed. Unlike the US, Europe tends to get bogged down with talks after talks and unable to make quick decisions.

Average Stock Holding Period on NYSE 1929 To 2016

The average stock holding period for stocks trading on the NYSE has declined to an astonishing 8.3 months as of December, 2016 according to an white paper published at MFS Investment Management Canada Limited. The curent holding period of less than a year is indeed shocking since stocks should be held for the long-term in order to achieve a particular goal or earn a high return on one’s investment. Constantly trading stocks is never a good strategy especially for retail investors. Some hedge fund manager, mutual fund managers and other institutional investors trade all day long because it is their full-time job. Even most of those professionals lose money most of the time.

From the paper:

Stocks are being held for shorter periods than at any time since the 1920s, as the New York Stock Exchange (NYSE) average holding period data shown in Exhibit 1 reveals. On average, a stock is being held for 1.92 years, less than eight quarters 8.3 months, less than a year (my updates).This reflects investment transactions driven by both individuals and institutional investors. Until the 1970s, the investment landscape was largely dominated by wealthy individuals and families; this has since changed markedly, with professional investors now accounting for the largest share of investment activity, though it should be noted that these professionals manage significant mutual fund asset pools that are driven by retail investors.

Click to enlarge

One might expect that professional investment managers would have a more long-term perspective; however, the data suggests that investment managers take an equally short-term view in their investment approach.

Their excellent paper also discusses some of the reasons for the dismal short-termism in the equity markets. For example, money managers have huge incentives to trade often since their compensation is based on annual performance.

SourceLENGTHENING THE INVESTMENT TIME HORIZON by Michael W. Roberge, CFA, Joseph C. Flaherty, Jr., Robert M. Almeida, Jr. and Andrew C. Boyd, MFS Canada

Also see: 

Knowledge is Power: US Banks, Successful Investors’ Habits, Gold Investing Edition

Roman Forum, Rome

Platts Top 250 Global Energy Companies 2017

S&P Global Platts published its annual ranking of the top 250 global energy companies for 2017 this week. The Top 10 Companies from this ranking are shown in the table below:

Click to enlarge

Source: S&P Global Platts

For the full listing of all the 250 firms please visit Platts Top 250 Global Energy Companies 2017 site.

The world’s top energy company is Gazprom OAO (OGZPY) of Russia followed by German utility E.ON(EONGY). American oil giant Exxon Mobil (XOM)came in at the ninth rank followed by Total(TOT) of France.

Disclosure: No positions