Economic Growth vs. Stock Market Returns: China and India

The economic growth of a country and its equity market returns are not directly linked. Conventional wisdom would imply that higher economic growth leads to higher equity market returns and vice versa. But that is not always the case. In fact, the relationship between a country’s GDP growth and its equity market returns is weak or in some cases non-existent To put it another way, the stock market can soar to sky high levels even with lower GDP growth. I written many times on this topic in the past some of which can be found here and here and here and here.

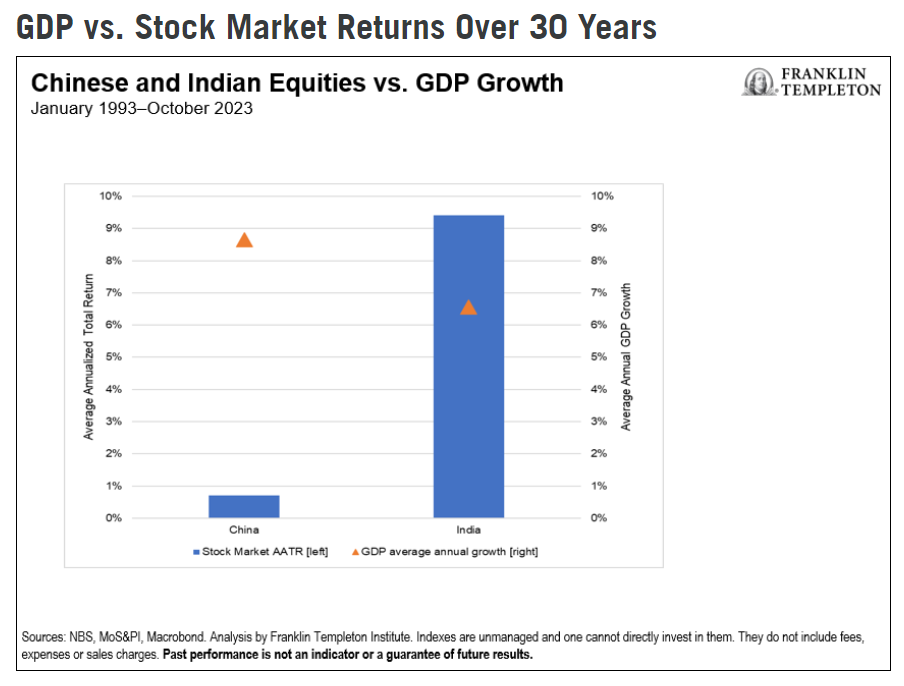
China and India are two of the major emerging markets. In terms of economic growth, the Chinese economy has had astonishing growth up until a few years ago. India’s economy also grew but at a much lower rate. However the returns on the Indian equity market has been much higher than that of China’s. A recent article at Franklin Templeton confirmed my long-held assumption. From the article:

In the chart below, while Chinese GDP growth as averaged 8.65% per annum in the last 30 years, the equity market’s average total return has been +0.7%. By contrast, India has had GDP growth of 6.5% per annum, yet the equity market has delivered an average total return of 9.4% in the same period.6
6. Past performance is not an indicator or a guarantee of future results.

Source: Consider This: Is India the new China? by Kim Catechis, Franklin Templeton

Mr.Kim also points out that India’s stock market is full of companies with lower floats. In many listed firms, the major shareholders are the promotors or insiders of the company. The promotors control 50% or more in the public companies. The middle-class investors have a very low participation rate in India’s stock market. They own only 10% through mutual funds and direct investments in stocks.

Another fact is that 90% of publicly listed companies in India are controlled by families according to one study. The low floats and high family ownerships make India’s stock market highly concentrated. While the equity returns are higher in India as shown above, the high concentration in the hands of a few poses a risk in the long run.

Related ETFs:

  • iShares S&P India Nifty 50 (INDY)
  • iShares MSCI India ETF (INDA)

Disclosure: No positions

Canada S&P/TSX Composite Index Annual Total Returns from 1920 to 2022: Chart

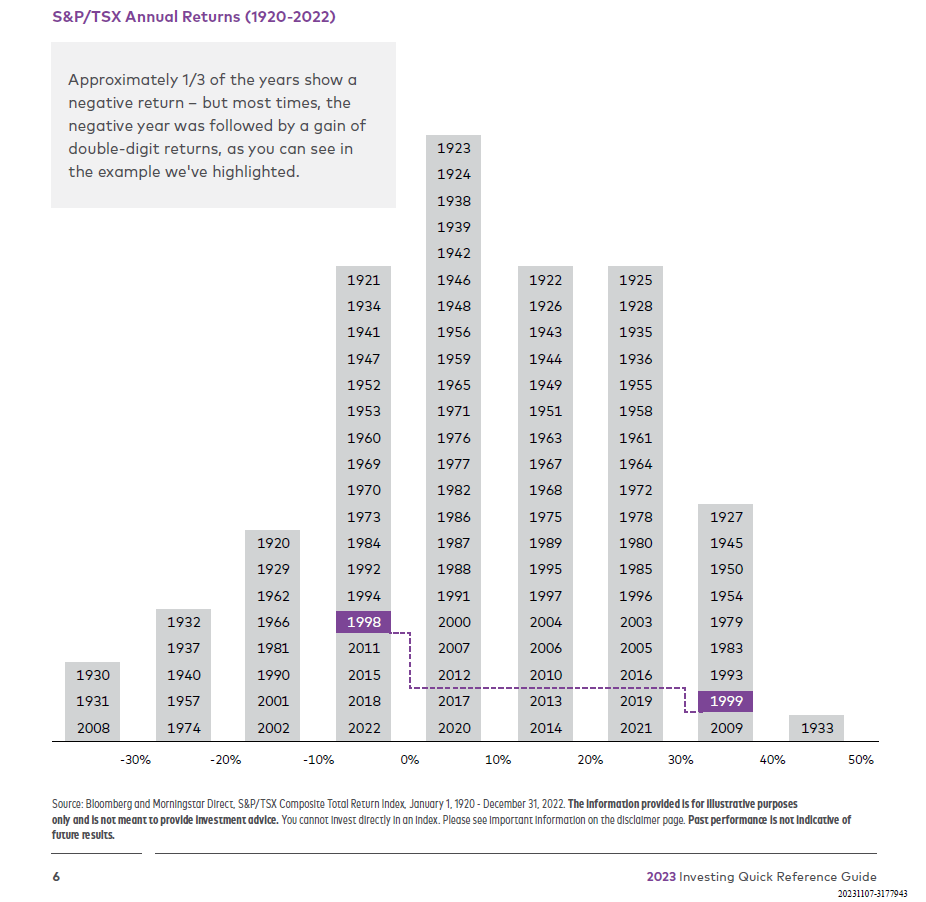
Canada’s benchmark S&P/TSX Composite Index is up by 7.12% on price return basis year-to-date as of December 21, 2023. The YTD total return, which includes reinvested dividends, is even better at 10.58%.

The TSX Composite Index has generated an annual total average return of 7.51% over the past 100 years from 1920 to 2022 according to a report by AGF Management Limited. As with other developed markets, there have been more positive years than negative during this period. Another point to remember is that many times negative years are followed by positive years as hi-lighted with one example in the chart below. This shows the importance of staying in the market for the long-term.

Click to enlarge

Source: 2023 Quick Reference Guide, AGF

Related ETF:

  •  iShares MSCI Canada ETF (EWC)

Disclosure: No positions

There Are Always Reasons NOT to Invest in Stock Market

Investing in equity markets involves risks. There are many types of risks and one of those is the risk of the unknown. Ideally investors would like to have a perfect world where there are no crises or unknowns so they can invest without having to deal with them. To put it another way, there are always reasons to not invest in the stock market. There are always one crisis or another that investors face. For instance, some of he risks that investors face include the ongoing crisis in the middle east, Ukraine-Russia war, etc.

I came the below graphic that shows 95 different reasons that investors had to invest in stocks since 1928. Over the decades there have been many crises from Cuban missile crisis to Vietnam war to the recent covid-19. Through all these crises stocks have gone up slowly higher as shown in the second chart below.

Click to enlarge

Source: 95 Reasons Why People Did NOT Invest in the Stock Market, Orion Portfolio Solutions

The key takeaway is that at any given time there will always be a reason not to invest in stocks. The trick is to ignore those noises and invest as per one’s risk tolerance and long-term goals.

Related ETFs:

  1. SPDR S&P 500 ETF (SPY)
  2. iShares Core S&P 500 ETF (IVV)
  3. Vanguard S&P 500 ETF (VOO)

Disclosure: No positions

Why Invest in Stocks and Bonds: Chart

Investing in equities and bonds is one of the best ways to grow wealth. This is especially true when it comes to long-term. Over many years or decades due to the effect of compounding stocks have historically generated the highest returns over bonds and other assets. The following chart shows the growth of $1 from 1926 to 2022. Small caps had a higher return than large caps in this long period. The chart also shows the return on bonds and T-Bills together with inflation.

Click to enlarge

Source: New York Life Investments

Related ETFs:

  1. SPDR S&P 500 ETF (SPY)
  2. iShares Core S&P 500 ETF (IVV)
  3. Vanguard S&P 500 ETF (VOO)

Disclosure: No positions