The Fed Funds Rate currently stands at 2.0%. For many years during the global financial crisis the rate stood at 0.25% which is effectively 0%. Then the rate started to slowly go up and was at 1.50% in Dec, 2017. The Fed targets a rate of 3.50% by 2020.
Higher rates lead to higher interest rates for consumers for products like credit cards, personal loans, mortgages, etc. Lower rates have the opposite effect.
US Fed tightening also leads to boom and bust cycles since lower rates help drive assets of all types to bubble levels and higher rates have the opposite effect basically creating booms and busts. The following chart shows the effect of fed tightening and the crises that followed from 1915:
Click to enlarge
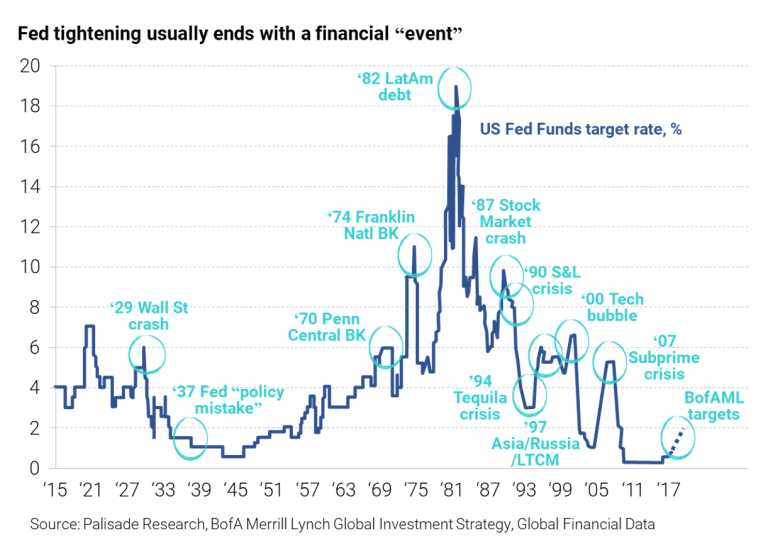
Source: The Oversold Gold Market Creates An Asymmetric Opportunity With This Strategy by Adem Tumerkan, Palisade Research
From the above article:
Many forget that most usually every time the Fed has tightened, there’s some sort of financial crisis.
It’s not hard to see why. . .
Putting it simply – as Austrian Economist Ludwig Von Mises, and Rogue Keynesian Economist Hyman Minsky have explained: cutting interest rates artificially boosts asset prices and destabilizes markets. And when rates are eventually raised later, the ‘malinvestment’ is revealed and liquidated – pushing asset prices down.
Hence the boom-bust cycle. There’s more to it – but that’s the gist: rate cuts spur the good years and form bubbles, and raising rates pops them.