The U.S. and majority of the countries in the world no longer follow the gold standard for money creation. Under that standard, a country had to backup its currency with equal amount of gold. That is no longer the case in the US as President Johnson removed the requirement for the Federal Reserve to hold gold to back the money it created. So since then the Fed has the authority to create money as much as it wants. Since it is just paper money billions of dollars could be created out of thin air anytime. An article by Gordon Long on the history of creditism provided some fascinating insights on money and credit. Below is a short excerpt from the piece:
Before 1968, a number of factors constrained how much Money and Credit could be created. Central Banks were constrained in the amount of Money they could create for two main reasons. First, they were required to own gold to back the Money they created; and there was only a limited amount of gold. The second reason was that they feared that too much Money creation would cause inflation.
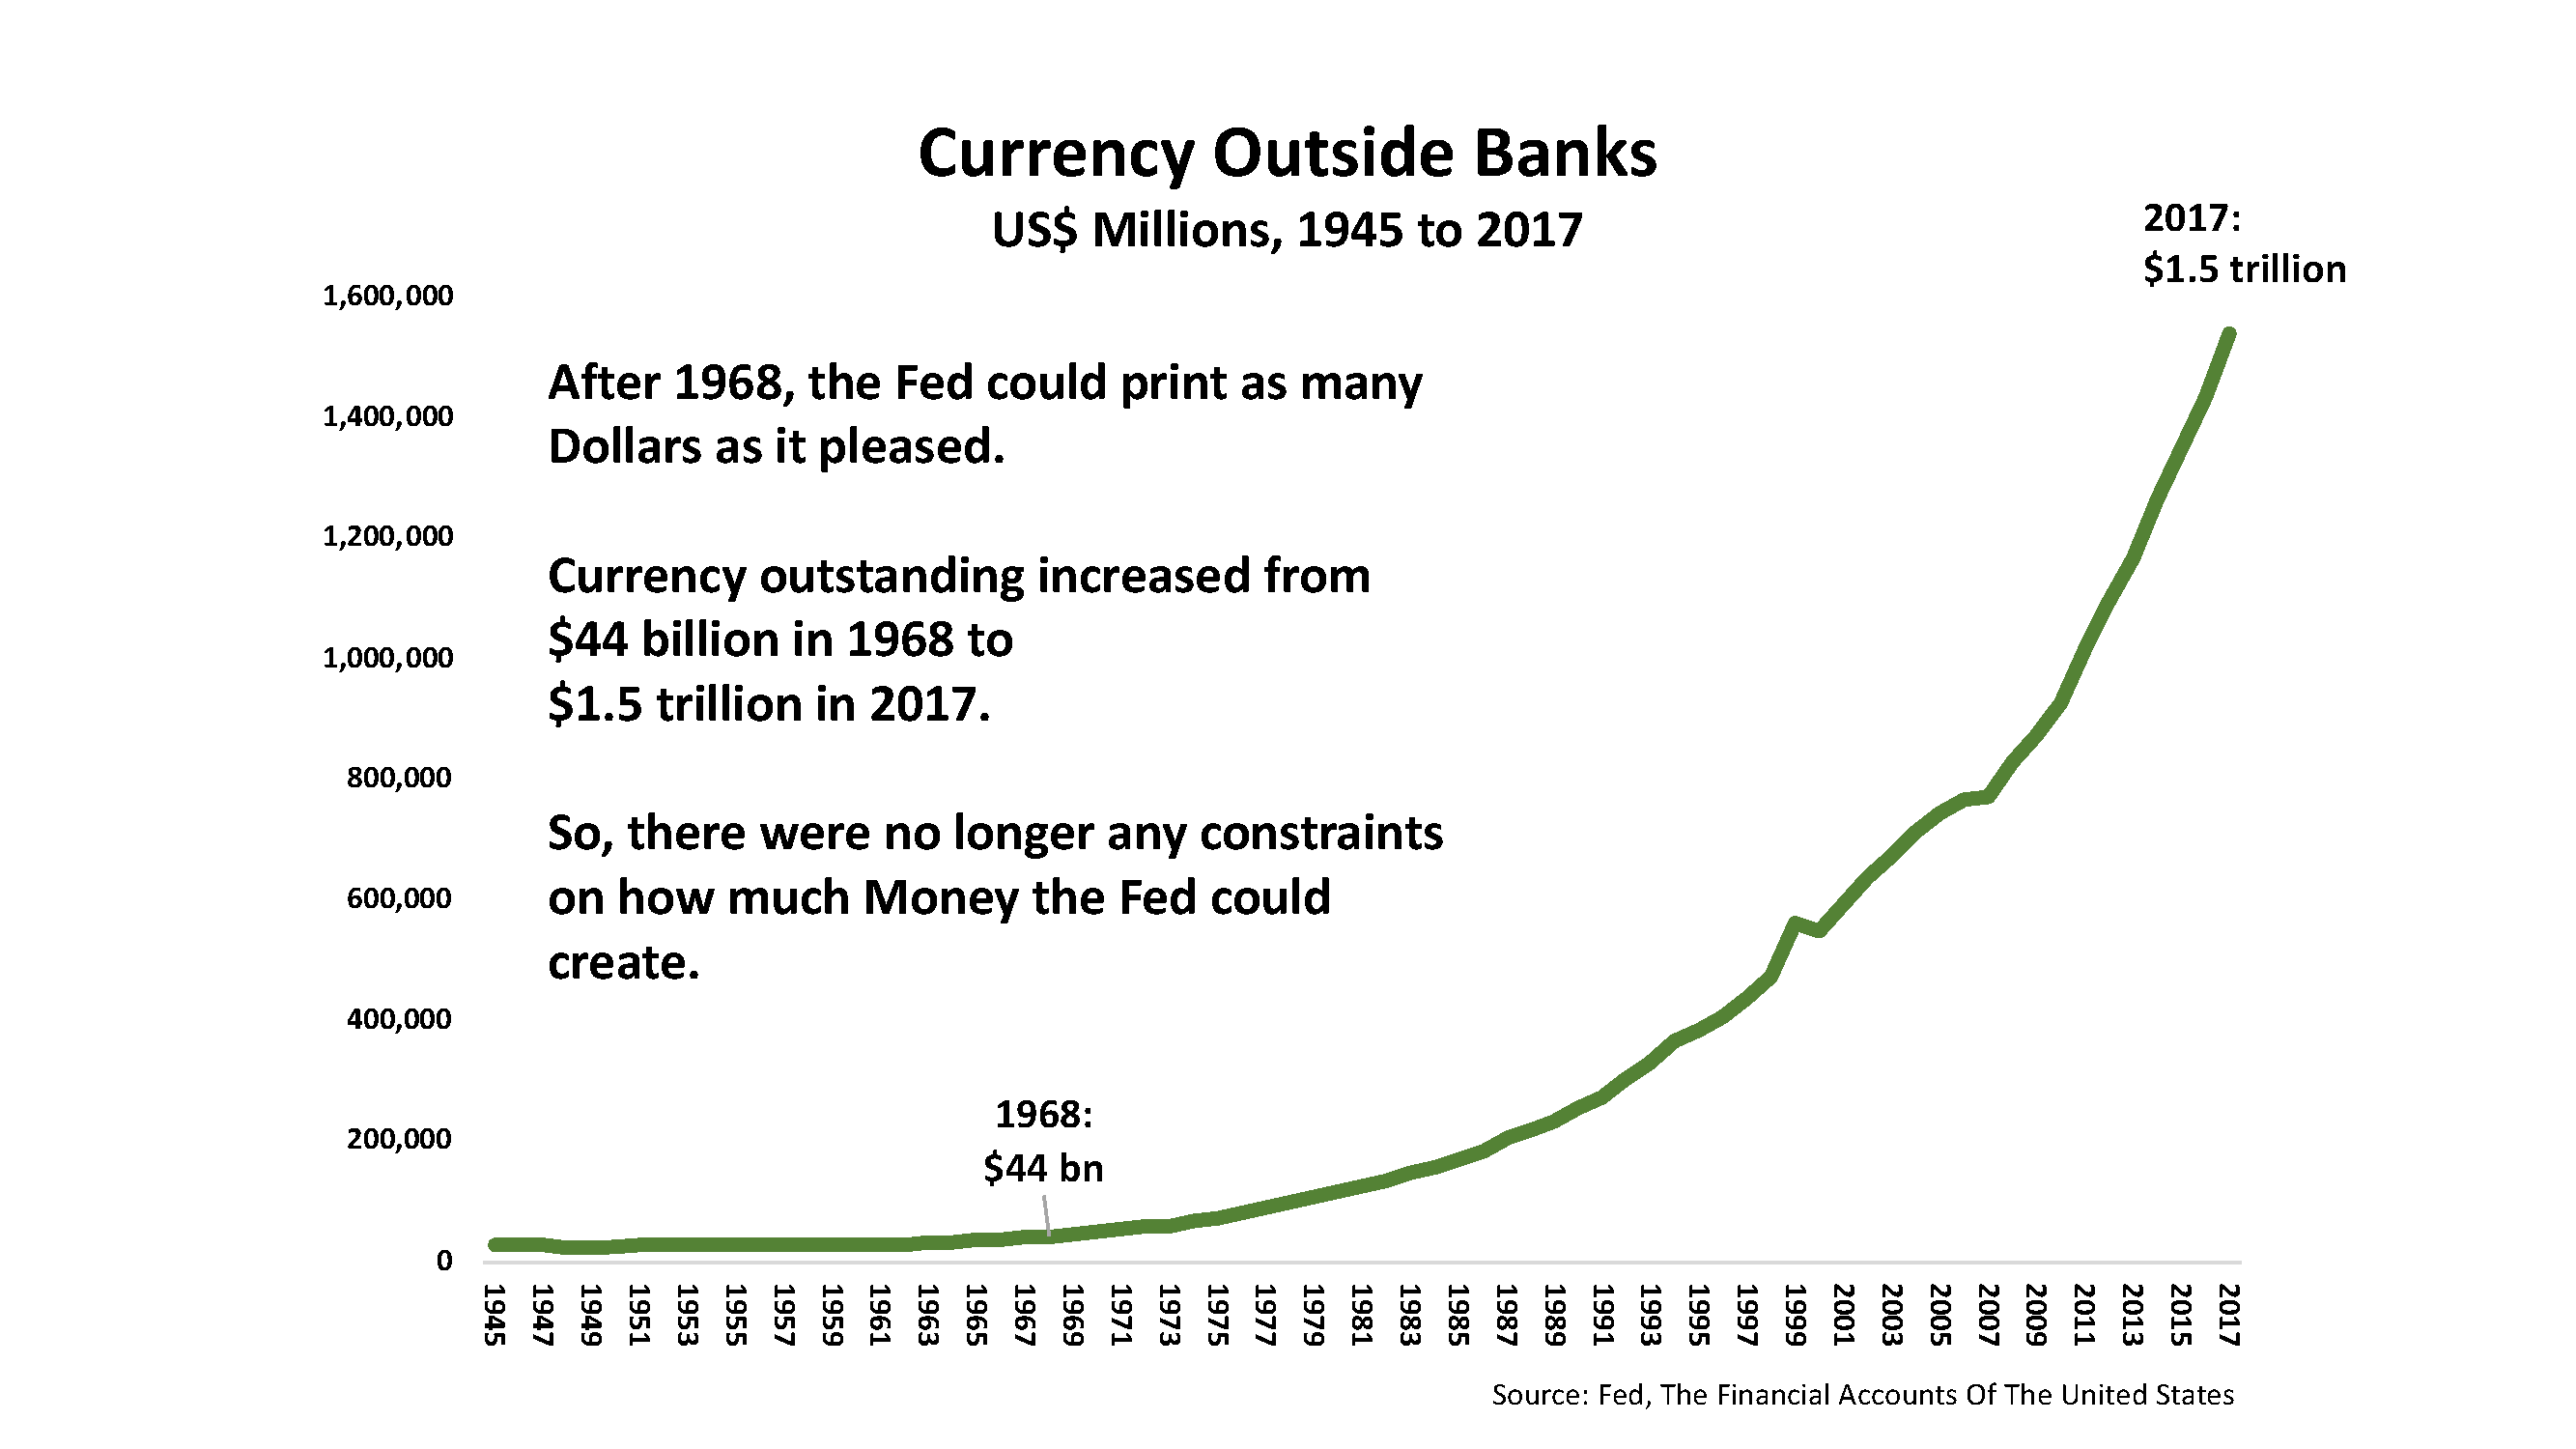
Credit creation by commercial banks was constrained by the amount of Money created by central banks, and by regulations that required the banks to set aside liquidity reserves against the deposits they accepted. Beginning in 1968, all of those constraints were removed one after another.
Afterwards, Money and Credit Creation exploded.
Between 1968 and 2017, the US Monetary Base expanded 53 times, from $66 billion to $3.5 trillion; while total Credit in the United States surged 48 times, from $1.4 trillion to $68 trillion.
Source: A Concise History Of Creditism , Gordon Long
The key takeaway is that the dollar today is backed by nothing but the faith the government. Explosion of credit has changed the US economy forever.