The following map shows the allies and enemies of Iran in the Middle East. Saudi Arabia is the biggest enemy of Iran.
Click to enlarge
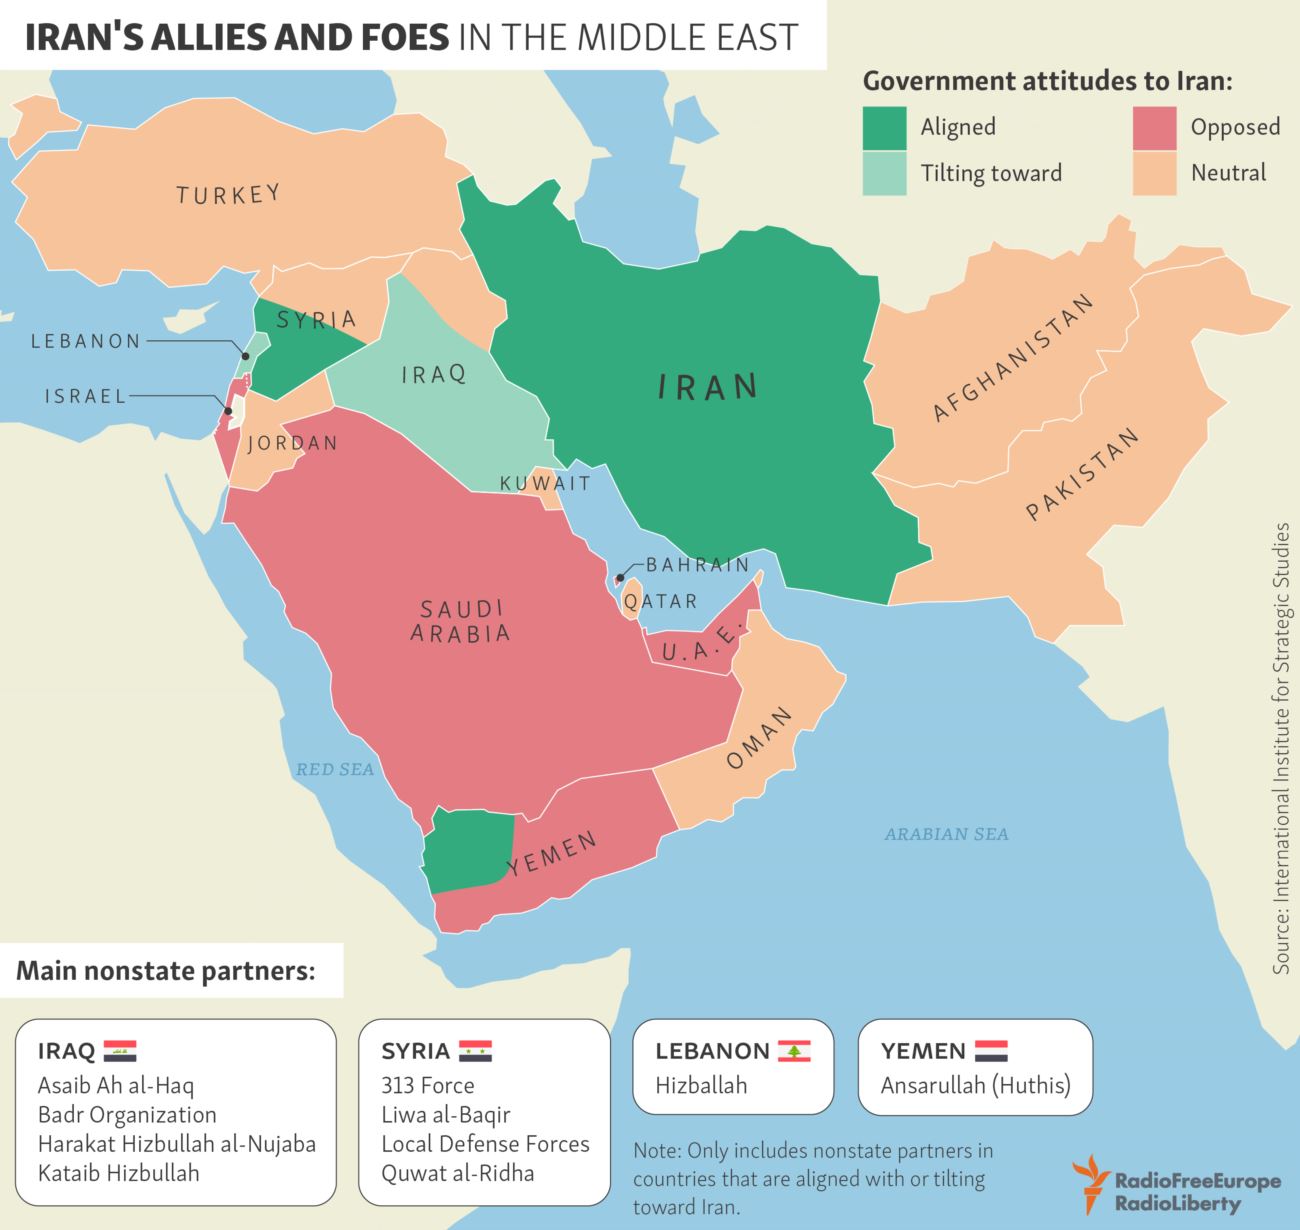
Source: RFE/RL
The following map shows the allies and enemies of Iran in the Middle East. Saudi Arabia is the biggest enemy of Iran.
Click to enlarge
Source: RFE/RL
U.S. Global Investors recently published the 2019 version of The Periodic Table of Emerging Markets chart. Similar to the Callan Table this one also offer excellent insights on the performance of emerging markets year over year from 2010 to 2019.
Click to enlarge
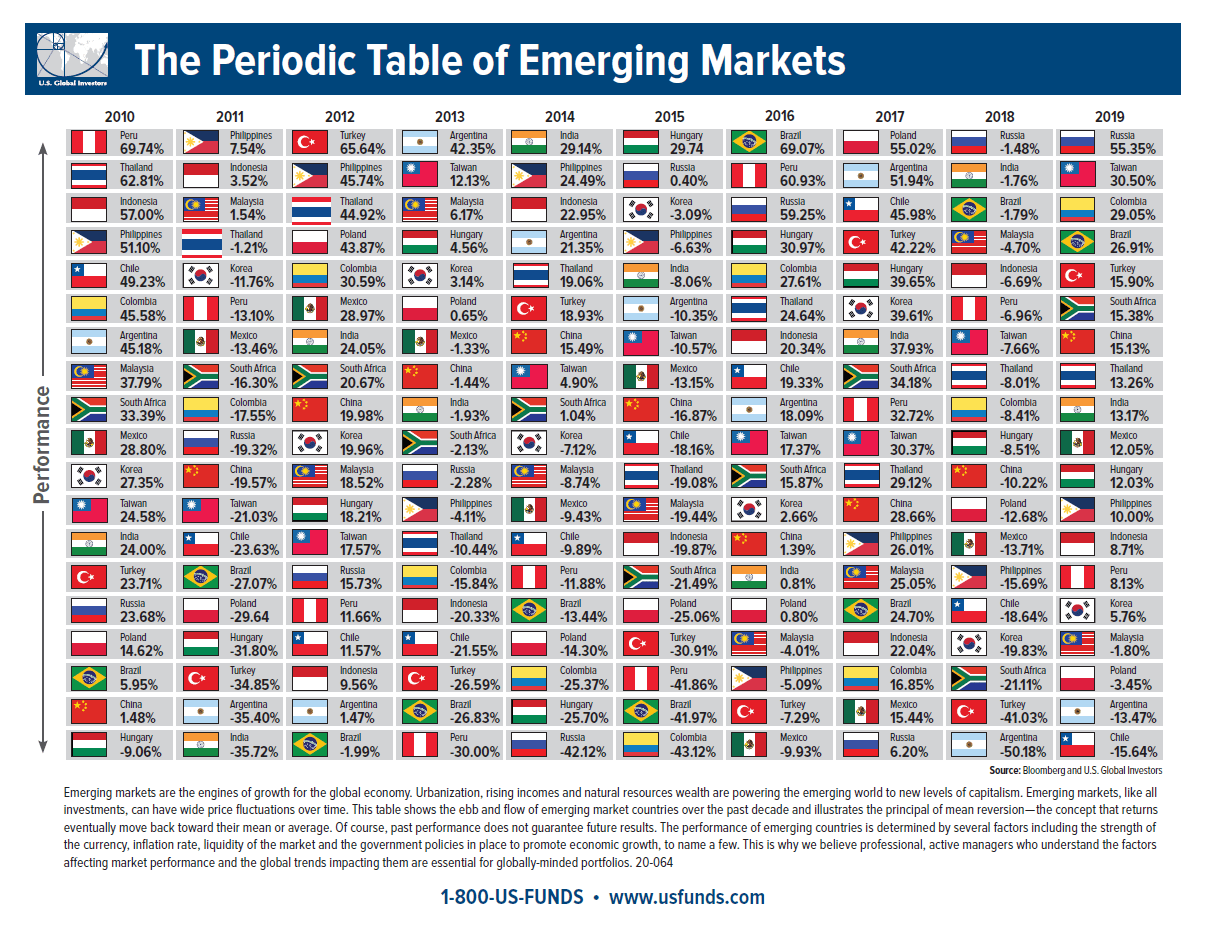
Source: U.S. Global Investors
The best performing emerging market last year was Russia which was also the top performer in 2018. Other Latin American countries such as Brazil and Colombia were also top performing markets in 2018. On the other end, Chile was the worst market followed by Argentina.
Earlier:
Related ETFs:
Disclosure: No Positions
The benefits of diversification across asset classes cannot be understated. Over the long-term diversification not only smooths out rough short-term variations in returns but also helps as cushion the blow when one asset class under-performs. With that said, the following 2019 Vanguard Index Chart and table from Vanguard Australia shows the advantages of diversification over the long-term using Australian stocks and other asset classes:
Click to enlarge


Source: Stay The Course – 2019 Vanguard Index Chart, Vanguard Australia
The infographic below shows some of the important differences between the common cold, influenza, coronavirus and other viruses:
Click to enlarge

Source: CompoundChem
Earlier:
The following infographic from the European Centre for Disease Prevention and Control (ECDC) shows some of the facts about the novel coronavirus COVID-19:
Click to enlarge

Source: European Centre for Disease Prevention and Control
Earlier: