The S&P 500 is up a decent 11.52% on price-return basis as of yesterday August 8, 2024 despite the sell-off in the markets last week. The annualized return over the past 5 years is 12.61%. The tech sector as represented by Information Technology and Communication Services accounts for just over 40% of the index as shown in the chart below. Hence in some ways the direction of the index is heavily influenced by tech stocks.
S&P 500 Sectors by Weight:
Click to enlarge
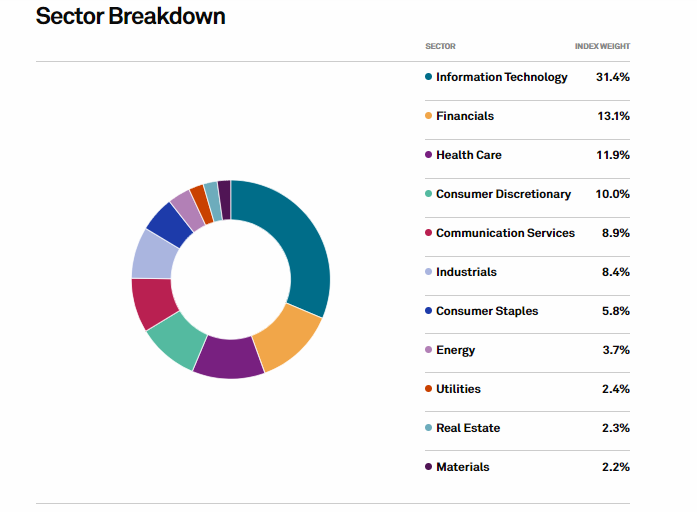
Source: S&P 500
With that said the P/E ratio of the Information Technology sector remains elevated and is the highest of all the sectors in the index according to a recent article in Asia Times.
Click to enlarge
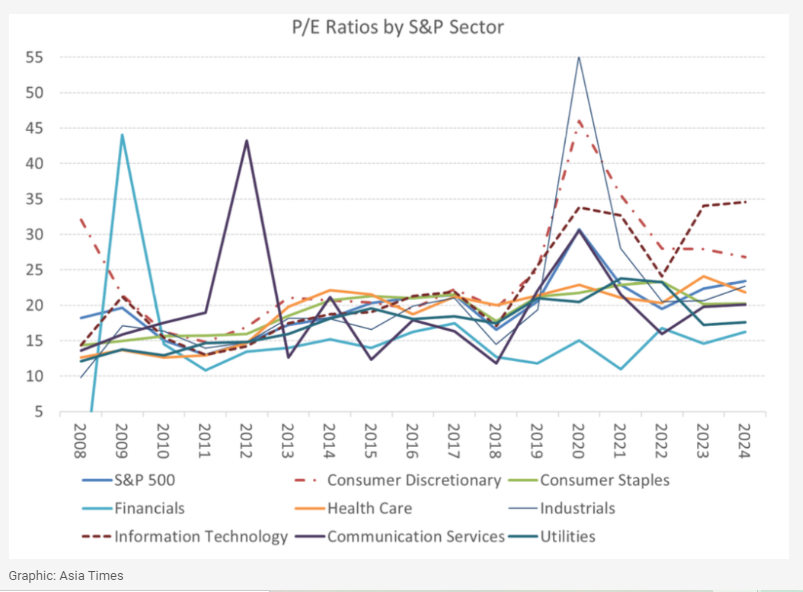
Source: A tale of two bubbles, Asia Times
As the US economic data continues to give mixed signals and the Fed is ready to reduce the interest rates soon, further volatility in equity markets can be expected. Investors need to be aware of this and act accordingly.
Related ETFs:
- SPDR S&P 500 ETF (SPY)
- iShares Core S&P 500 ETF (IVV)
- Vanguard S&P 500 ETF(VOO)
- SPDR Portfolio S&P 500 ETF (SPLG)
Disclosure: No positions


