The following is an excerpt of the U.S. economy from the CIA’s The World Factbook site:
The US has the largest and most technologically powerful economy in the world, with a per capita GDP of $47,200. In this market-oriented economy, private individuals and business firms make most of the decisions, and the federal and state governments buy needed goods and services predominantly in the private marketplace. US business firms enjoy greater flexibility than their counterparts in Western Europe and Japan in decisions to expand capital plant, to lay off surplus workers, and to develop new products.
While the U.S. has the largest economy in the world, it is also vulnerable to economic crises of all forms and sizes. Due to structural and political setup, the U.S. economy follows a boom and bust cycle with expansion and contraction occurring every few years or so. Accordingly fortunes are made and lost.
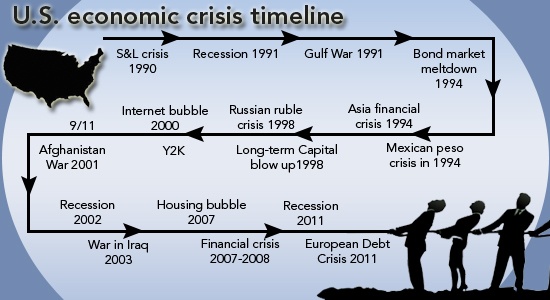
The following graphic illustrates my point with all the major events faced by the U.S. economy since 1990:
Click to enlarge
Source: Time to reconsider stocks, Fidelity Viewpoints
Dr. Claus te Wildt, the author of the above report notes that the Dow Jones Industrials Average(DJIA) more than quadrupled from about 2,500 in September of 1990 to over 12,000 in February of this year. He says this performance shows the power of equities and the strength of the U.S. economy.
However he ignores to mention certain important facts in his report such as comparing the DJIA performance in shorter periods.The DJIA reached 10,000 for the first time in March 1999. At the start of 2000, it stood at 11,501.By the end of December,2010 it stood at just 11,577 which implies that the index basically went nowhere in a decade.Furthermore last Friday it closed at 11,240 which is lower than the 11,501 at the beginning of 2000. So we can conclude that a high number of economic crises in short time periods such as two decades adversely affects the performance of equities.


