On 19 October 1987 the Dow Jones fell an astonishing 22.6% making it the worst one day fall in its history. That day has gone into the history books as the “Black Monday”.
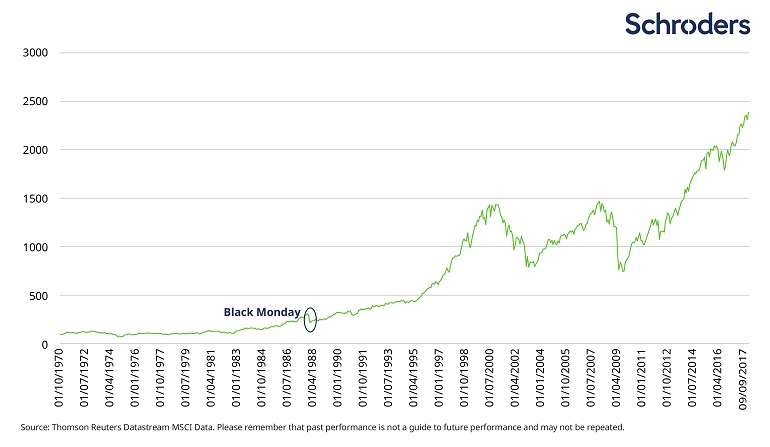
Though Black Monday was a terrible day for equity investors it was just a blip in the long term returns of the US equity market. The following chart shows the long-term returns of the MSCI USA Index from 1970 thru September 2017:
Click to enlarge
MSCI USA: 1970-2017 and the blip that was Black Monday
Source: Black Monday 30 years on: how it happened and what we can learn by David Brett, Schroders
From David’s above article:
The chart above (edited) reflects the fluctuations in the US stockmarket since 1970. It illustrates how Black Monday registered as barely a blip in the long term and how resilient stocks have been over the last 47 years.
Those who invested after Black Monday would have seen $100 turned into $1,135 without considering the dividend income paid out. That high return was achieved despite remaining invested through the dotcom crash of 2000-03 and the global financial crisis of 2007-09.
The takeway for investors is that in the long-run even scary one-day plunges in markets may become inconsequential in terms of returns. When markets take dramatic turns like that Monday 30 years ago investors need to remain calm and not sell out. Instead of panicking investors have to focus on their long-term goal and simply ride out the storm. The above example shows how patient investors were rewarded after enduring the dot com and the global financial crisis of 2008-09.
Update:
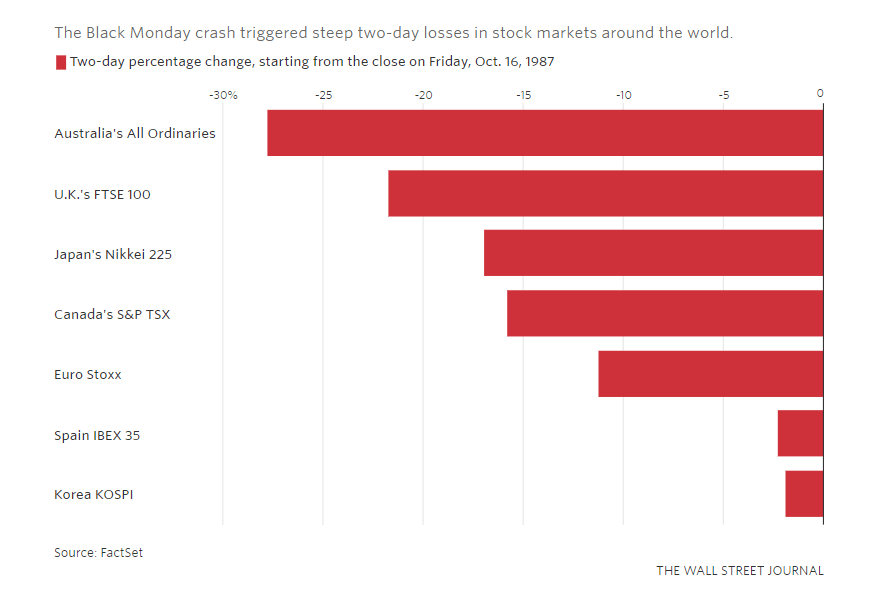
Global Markets following Black Monday, 1987:
Click to enlarge
Source: WSJ
