In earlier posts we looked at the return charts for emerging markets, developed markets and the S&P 500 for 2024. In this post, let’s review the annual returns chart for asset classes from 2010 to 2024. Last year, large caps were the top performers while the worst performer was high yield bonds with a return of just 1.3%.
Click to enlarge
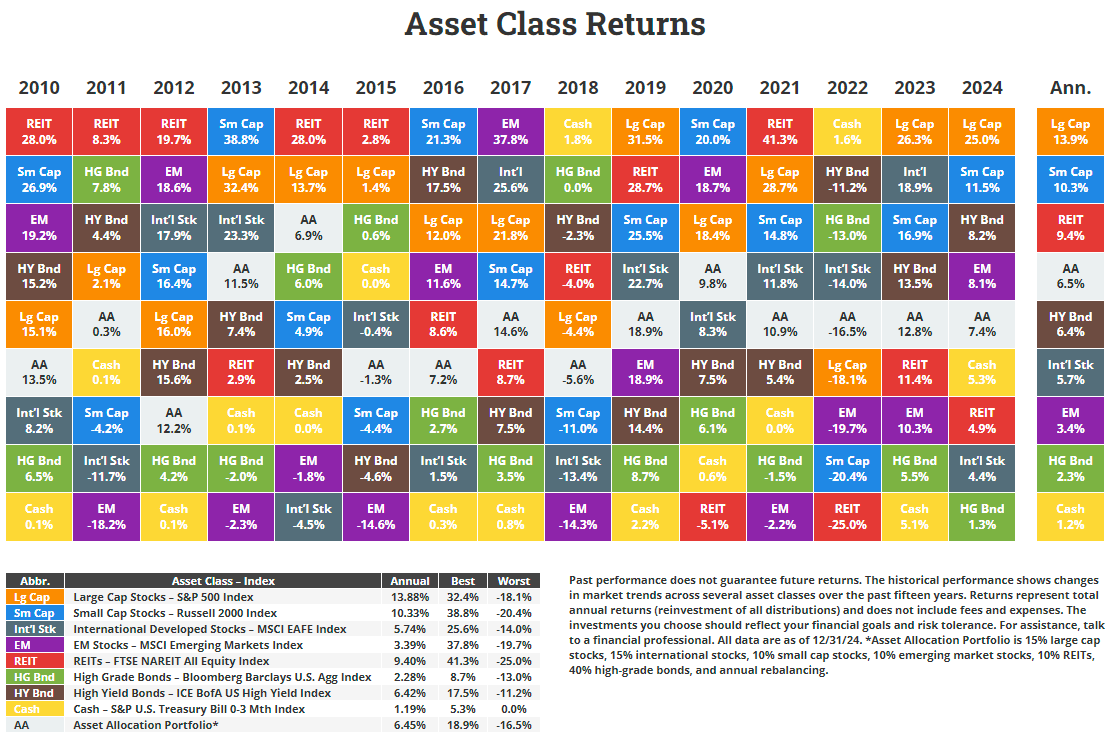
Source: Novel Investor
Developed stocks outside of the US also had poor returns with a return of 4.4%. For many years in a row foreign developed markets have under-performed the S&P 500. However so far this year they are ahead of the US markets. It remains to be seen if they indeed beat the S&P 500 this year.
Related ETFs:
- SPDR S&P 500 ETF (SPY)
- iShares Core S&P 500 ETF (IVV)
- Vanguard S&P 500 ETF (VOO)
- SPDR Portfolio S&P 500 ETF (SPLG)
- Vanguard Developed Markets Index Fund ETF (VEA)
Disclosure: No positions