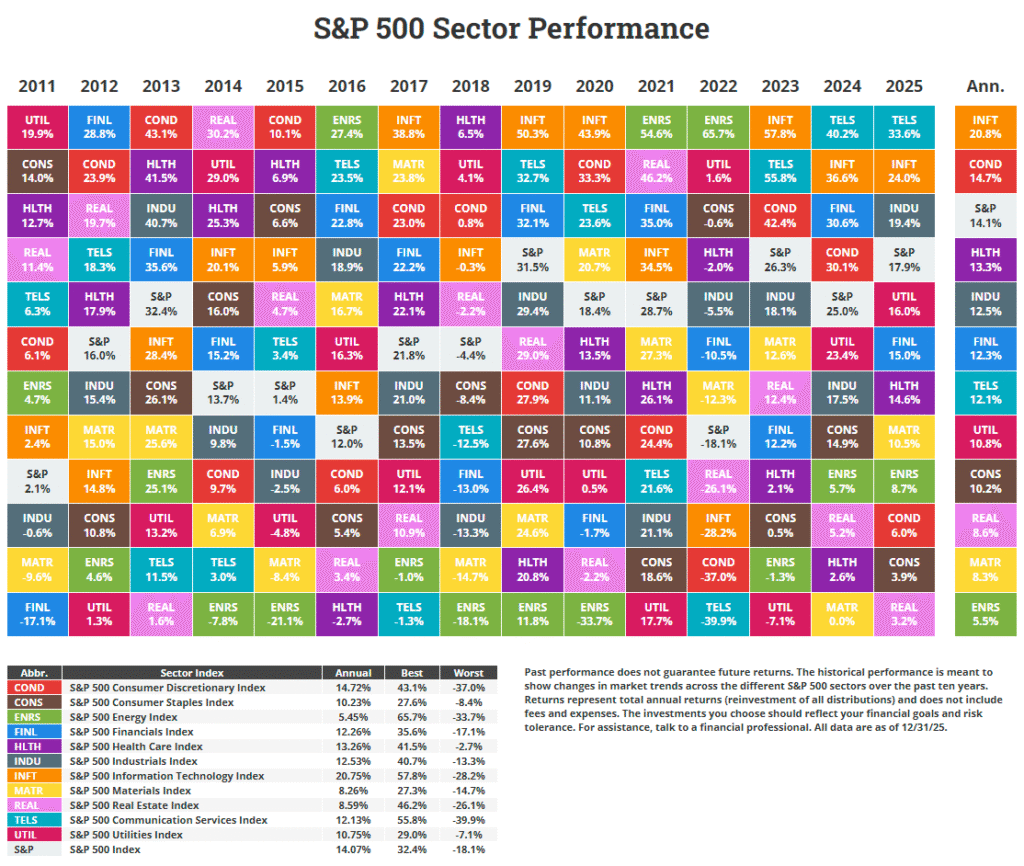
The S&P Sector Performance chart for the year 2024 was published by Novel Investor a few weeks ago. This chart shows the annual total returns of the various sectors in the S&P 500 index from 2010 to 2024. For the second year in a row, the tech sector was the best performer and the worst performer was the materials sector as shown in the chart below. The real estate sector is still suffering since the Covid-19 pandemic and ended the year with a 5.2% return.
Click to enlarge
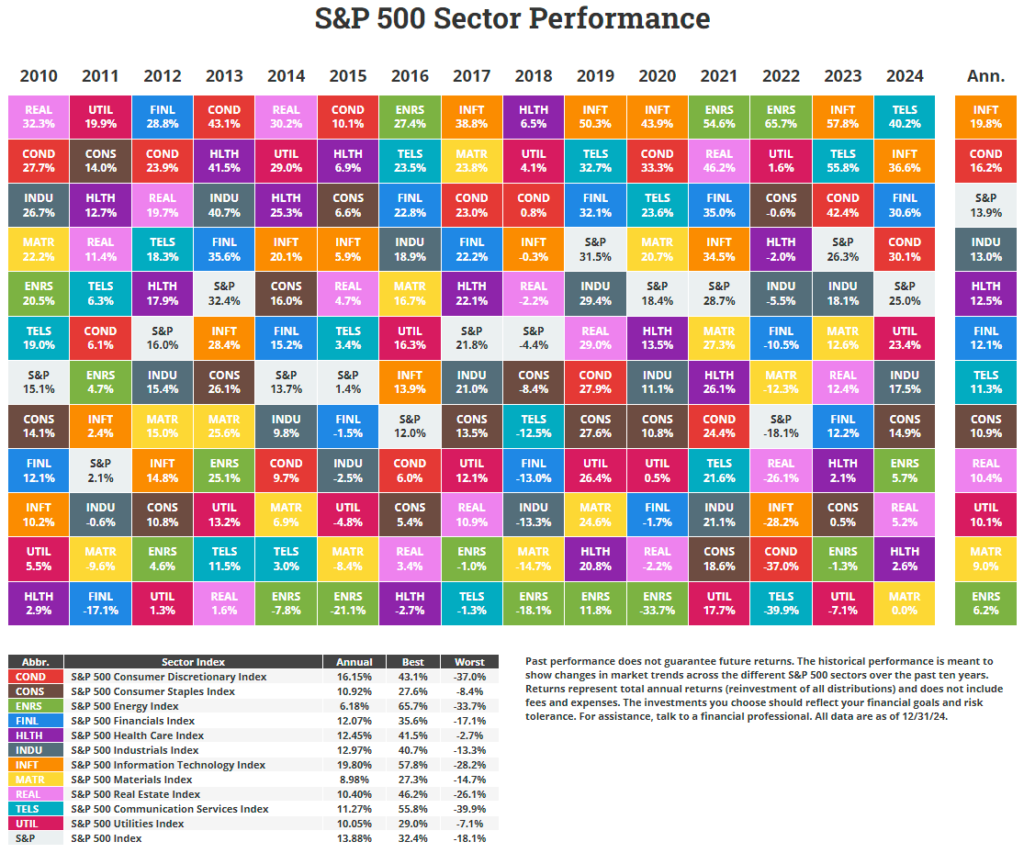
Source: Novel Investor
For an interactive version of the above chart click on the link above.
Related ETFs:
- SPDR S&P 500 ETF (SPY)
- S&P MidCap 400 SPDR ETF (MDY)
- SPDR Consumer Discretionary Select Sector SPDR Fund (XLY)
- SPDR Consumer Staples Select Sector SPDR Fund (XLP)
- SPDR Energy Select Sector SPDR Fund (XLE)
- SPDR Financials Select Sector SPDR Fund (XLF)
Disclosure: No Positions
