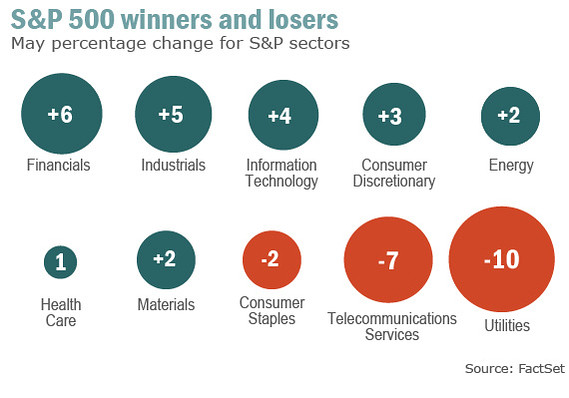
Stocks in the U.S. utility sector are lagging the performance of the overall market so far this year. While the utilities was performing up until recently, last month they fell heavily. The proxy for sector, the SPDR Utilities Select Sector (XLU) was down 8.5% just in last month through the 30th and is up only about 6.0% year-to-date compared to S&P 500’s rise of 14.3% . According to an article in The Wall Street Journal utilities are down for two reasons.
From the Journal article:
Generally slow-but-steady, utility stocks once held strong appeal because of their high dividend payouts and sturdy performance. But rising optimism about the pace of economic growth is prompting ETF investors to move into sectors more closely tied to growth, like technology and industrials.
Others are bailing on utilities because bond yields are rising on speculation that the Federal Reserve might pare back its monthly asset-purchase program. The promise for high payouts from bonds reduces the need to squeeze income from utility stocks, investors say.
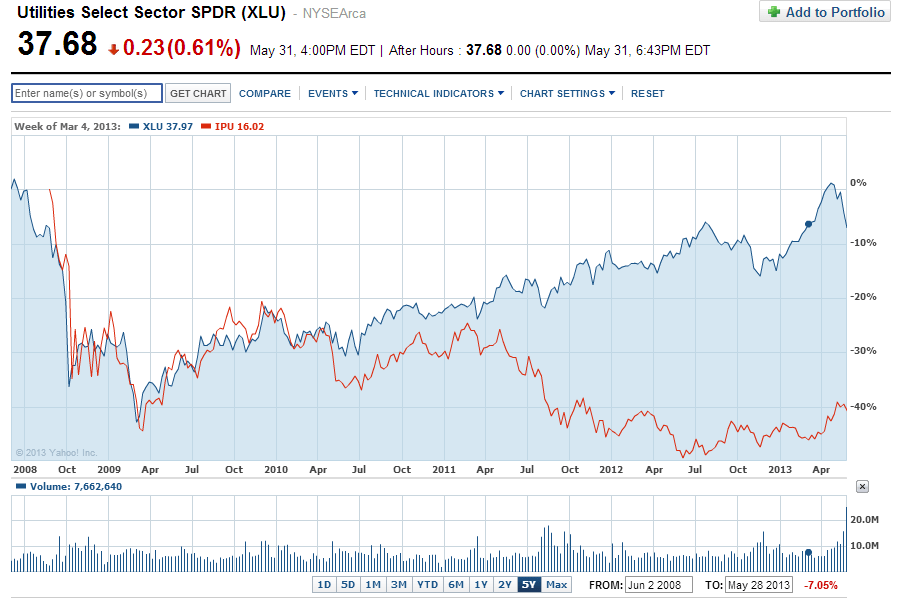
While investors are fleeing U.S. utility stocks they may want to consider investing in international utilities. European utility stocks which were on a downward trend for a few years seems to have turned a corner. For example, in the past 5 years, the STOXX® Europe 600 Utilities was down by over 46% but so far this year it is up about 2% excluding dividends.
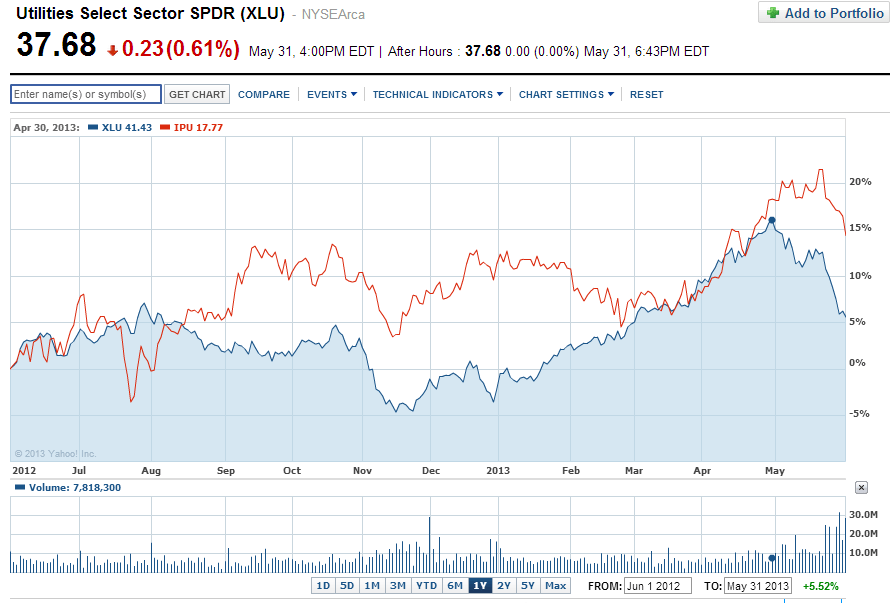
The SPDR S&P International Utilities Sector ETF (IPU) tracks the performance of the utilities in developed countries excluding the U.S. The fund is up by 1.72% year-to-date based on price only. This fund can also be considered somewhat as a proxy for European utilities since the majority of the fund’s assets are invested in utility companies of Europe.
5-year chart comparing the performance of XLU and IPU:
Click to enlarge
1-year chart comparing the performance of XLU and IPU:
Click to enlarge
Source: Yahoo Finance
I have used the 1-year chart for comparison instead of year-to-date chart to show the improvement in the international utilities ETF.
The table below shows some of the metrics of the two ETFs:
| Metric | SPDR Utilities Select Sector (XLU) | SPDR S&P International Utilities Sector ETF (IPU) |
|---|---|---|
| Total Net Assets | $5.7 Billion | $28.8 Million |
| Dividend Yield | 3.83% | 4.06% |
| Number of Holdings | 33 | 105 |
| Distribution Frequency | Quarterly | Quarterly |
Source: SPDRs
Compared to the ETF for U.S. utilities, the SPDR S&P International Utilities Sector ETF (IPU) has a tiny asset base of over $28.0 million. About 38% of the assets are invested in two countries – the UK and Japan. The top three holdings in the fund are National Grid (NGG) of UK, Germany’s E.ON SE (EONGY) and GDF Suez SA (GDFZY) of France.
Since international utilities have lagged their U.S. peers for many years and U.S. economic recovery may actually hurt utility stocks investors can consider adding selective foreign utility stocks at current levels.
Disclosure: Long EONGY
Update:
 Source: Why dividend yield stocks are getting dumped, MarketWatch


