Some of the European ADRs trading on the New York Stock Exchange were listed there many years ago. A list of ten such ADRs that were listed in the 1980s and 90s is shown in the table below with their current dividend yields:
| S.No. | Company | Ticker | Dividend Yield as of Dec 4, 2012 | Country | Industry |
|---|---|---|---|---|---|
| 1 | BT Group | BT | 3.72% | United Kingdom | Fixed Line Telecom. |
| 2 | GlaxoSmithKline | GSK | 5.29% | United Kingdom | Pharma. & Biotech. |
| 3 | Koninklijke Philips Electronics - | PHG | 3.64% | Netherlands | Leisure Goods |
| 4 | Novo Nordisk | NVO | 1.58% | Denmark | Pharma. & Biotech. |
| 5 | TOTAL | TOT | 5.91% | France | Oil & Gas Producers |
| 6 | Natuzzi | NTZ | N/A | Italy | HouseGoods&HomeConst |
| 7 | Nokia | NOK | 7.75% | Finland | Tech.Hardware&Equip. |
| 8 | STMicroelectronics | STM | 6.29% | Switzerland | Tech.Hardware&Equip. |
| 9 | Portugal Telecom | PT | 17.43% | Portugal | Fixed Line Telecom. |
| 10 | Bank of Ireland | IRE | N/A | Ireland | Banks |
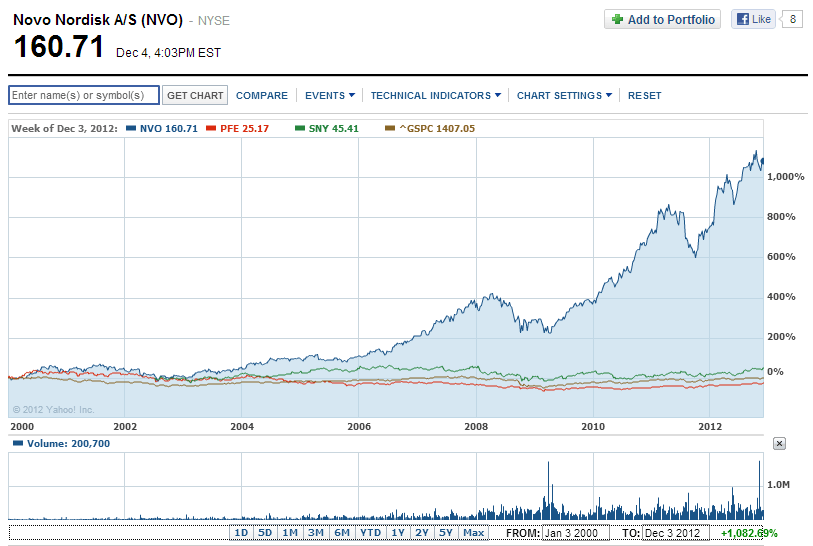
Of the companies noted above, Denmark-based pharmaceutical firm Novo Nordisk (NVO) has had an incredible run since 2000 growing by over 1,800%. The company offers a range of diabetes products and provides treatments for people with haemophilia, growth hormone deficiency and for women experiencing symptoms of menopause. Its products are marketed in more than 190 countries.Total revenues in 2011 was over $13.0 billion and the profit margin was about 27%. A $10,000 investment in NVO five years ago would be worth $27,160 with dividends reinvested, according to S&P.
A chart showing the performance of Novo Nordisk against France’s Sanofi (SNY), Pfizer (PFE) and S&P 500 is shown below:
Click to enlarge
Source: Yahoo Finance
Disclosure: No Positions

