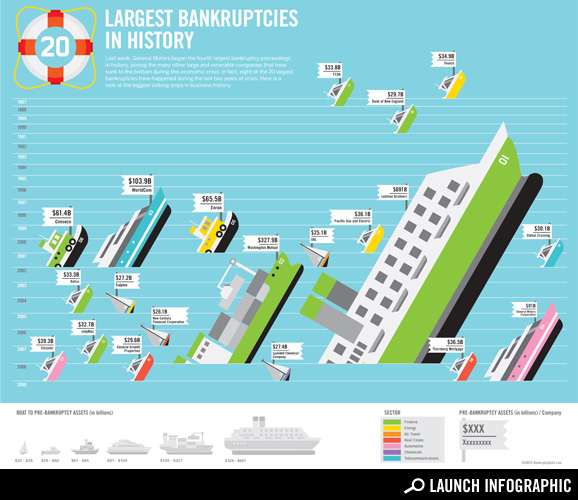
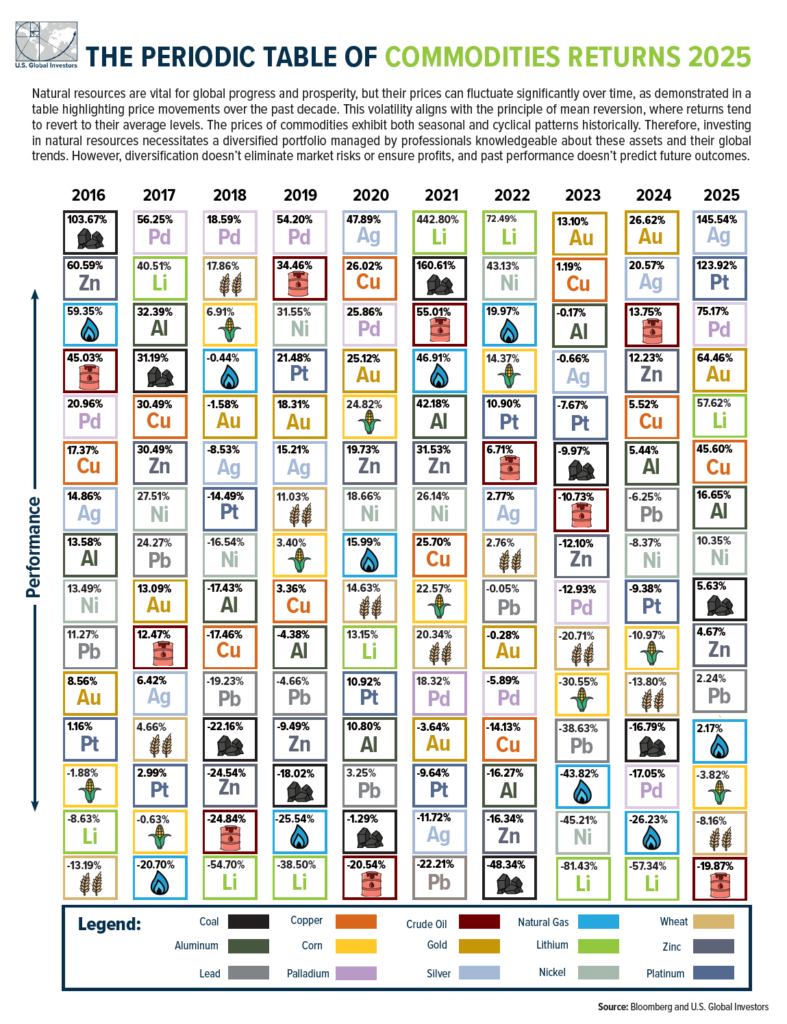
Chart: The Largest Bankruptcies in History Posted by David Hunkar on 16 June 2009, 11:04 pm Click on Graph to Enlarge Credit:Â Good Magazine at http://www.good.is Related posts:Asset Class Annual Returns 2006 to 2025: ChartS&P 500 Sector Performance 2011 To 2025: ChartDeveloped Market Annual Total Returns from 2011 to 2025: ChartThe Periodic Table of Commodities Returns 2025: Chart