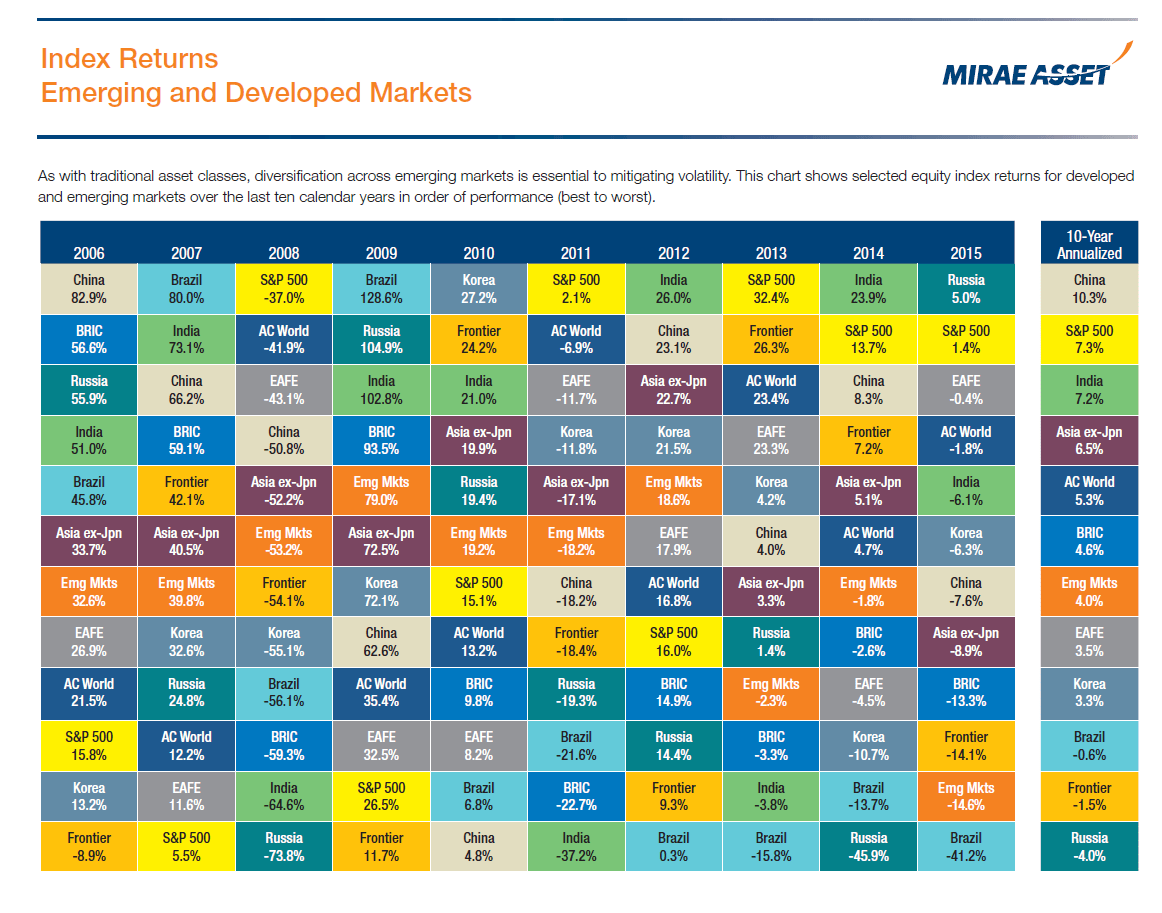
I recently came across the following unique chart that compares the returns of Developed, Emerging and Frontier Markets from 2006 thru 2015. The popular charts like Single Country Index Returns chart, emerging markets returns chart, Callan Periodic Table of Investment Returns are easily available online. I will post the updated chart for 2016 when it is published.
Click to enlarge
Source: Mirae Asset Global Investments (USA) LLC
Note: The returns shown above are total returns which includes dividend reinvested.
Download: Index Returns: Developed, Emerging and Frontier Markets 2006-2015 (in pdf)
A few observations:
- The US market as represented by S&P 500 has performed well relative to other markets since 2008. Even in 2008, when emerging and frontier markets plunged by 50% or more, the S&P 500 fell only 37%.
- In terms of annualized returns over 10 years, Chinese stocks did not have awesome returns when compared to US stocks. As an emerging market that experienced explosive economic growth one would have expected Chinese stocks to vastly outperform US equities.
- In 2014, Russia was the worst performer but in 2015 it was the best performer. This shows the futility of picking markets and the importance of diversification.
Related ETFs:
- iShares MSCI Emerging Markets ETF (EEM)
- Vanguard MSCI Emerging Markets ETF (VWO)
- SPDR S&P 500 ETF (SPY)
- PowerShares MENA Frontier Countries ETF (PMNA)
Disclosure: No Positions