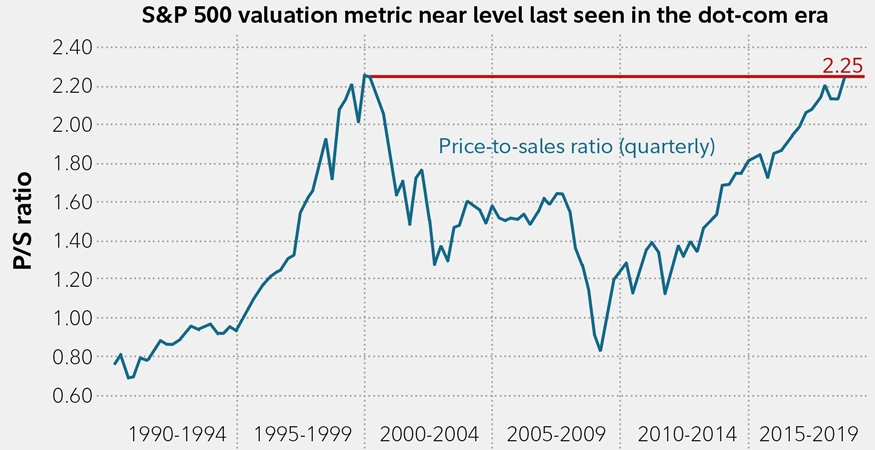
U.S. equities are reaching record highs and some investors are wondering how long the current bull market will last. The S&P 500 is up by over 9% on price basis YTD. Currently the P/E ratio of the index is 25.38. Based on the price to sales ratio stocks are reaching the levels last reached during the dot-com era as the chart below shows:
Click to enlarge
The S&P 500’s price-to-sales (P/S) multiple is approaching dot-com era highs, suggesting the market may be expensive at current levels. Its trailing 12-month price-to-sales ratio surged to 2.25 recently, the highest since early 2000. And it’s not just tech giants skewing the data: The median P/S ratio for index members is more than twice the level of the dot-com peak.
Source: Fidelity
Related ETFs:
- SPDR S&P 500 ETF (SPY)
- S&P MidCap 400 SPDR ETF (MDY)
- SPDR Consumer Discretionary Select Sector SPDR Fund (XLY)
- SPDR Consumer Staples Select Sector SPDR Fund (XLP)
- SPDR Energy Select Sector SPDR Fund (XLE)
- SPDR Financials Select Sector SPDR Fund (XLF)
- iShares Dow Jones Select Dividend ETF (DVY)
- SPDR S&P Dividend ETF (SDY)
- Vanguard Dividend Appreciation ETF (VIG)
Disclosure: No Positions