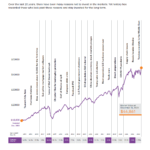
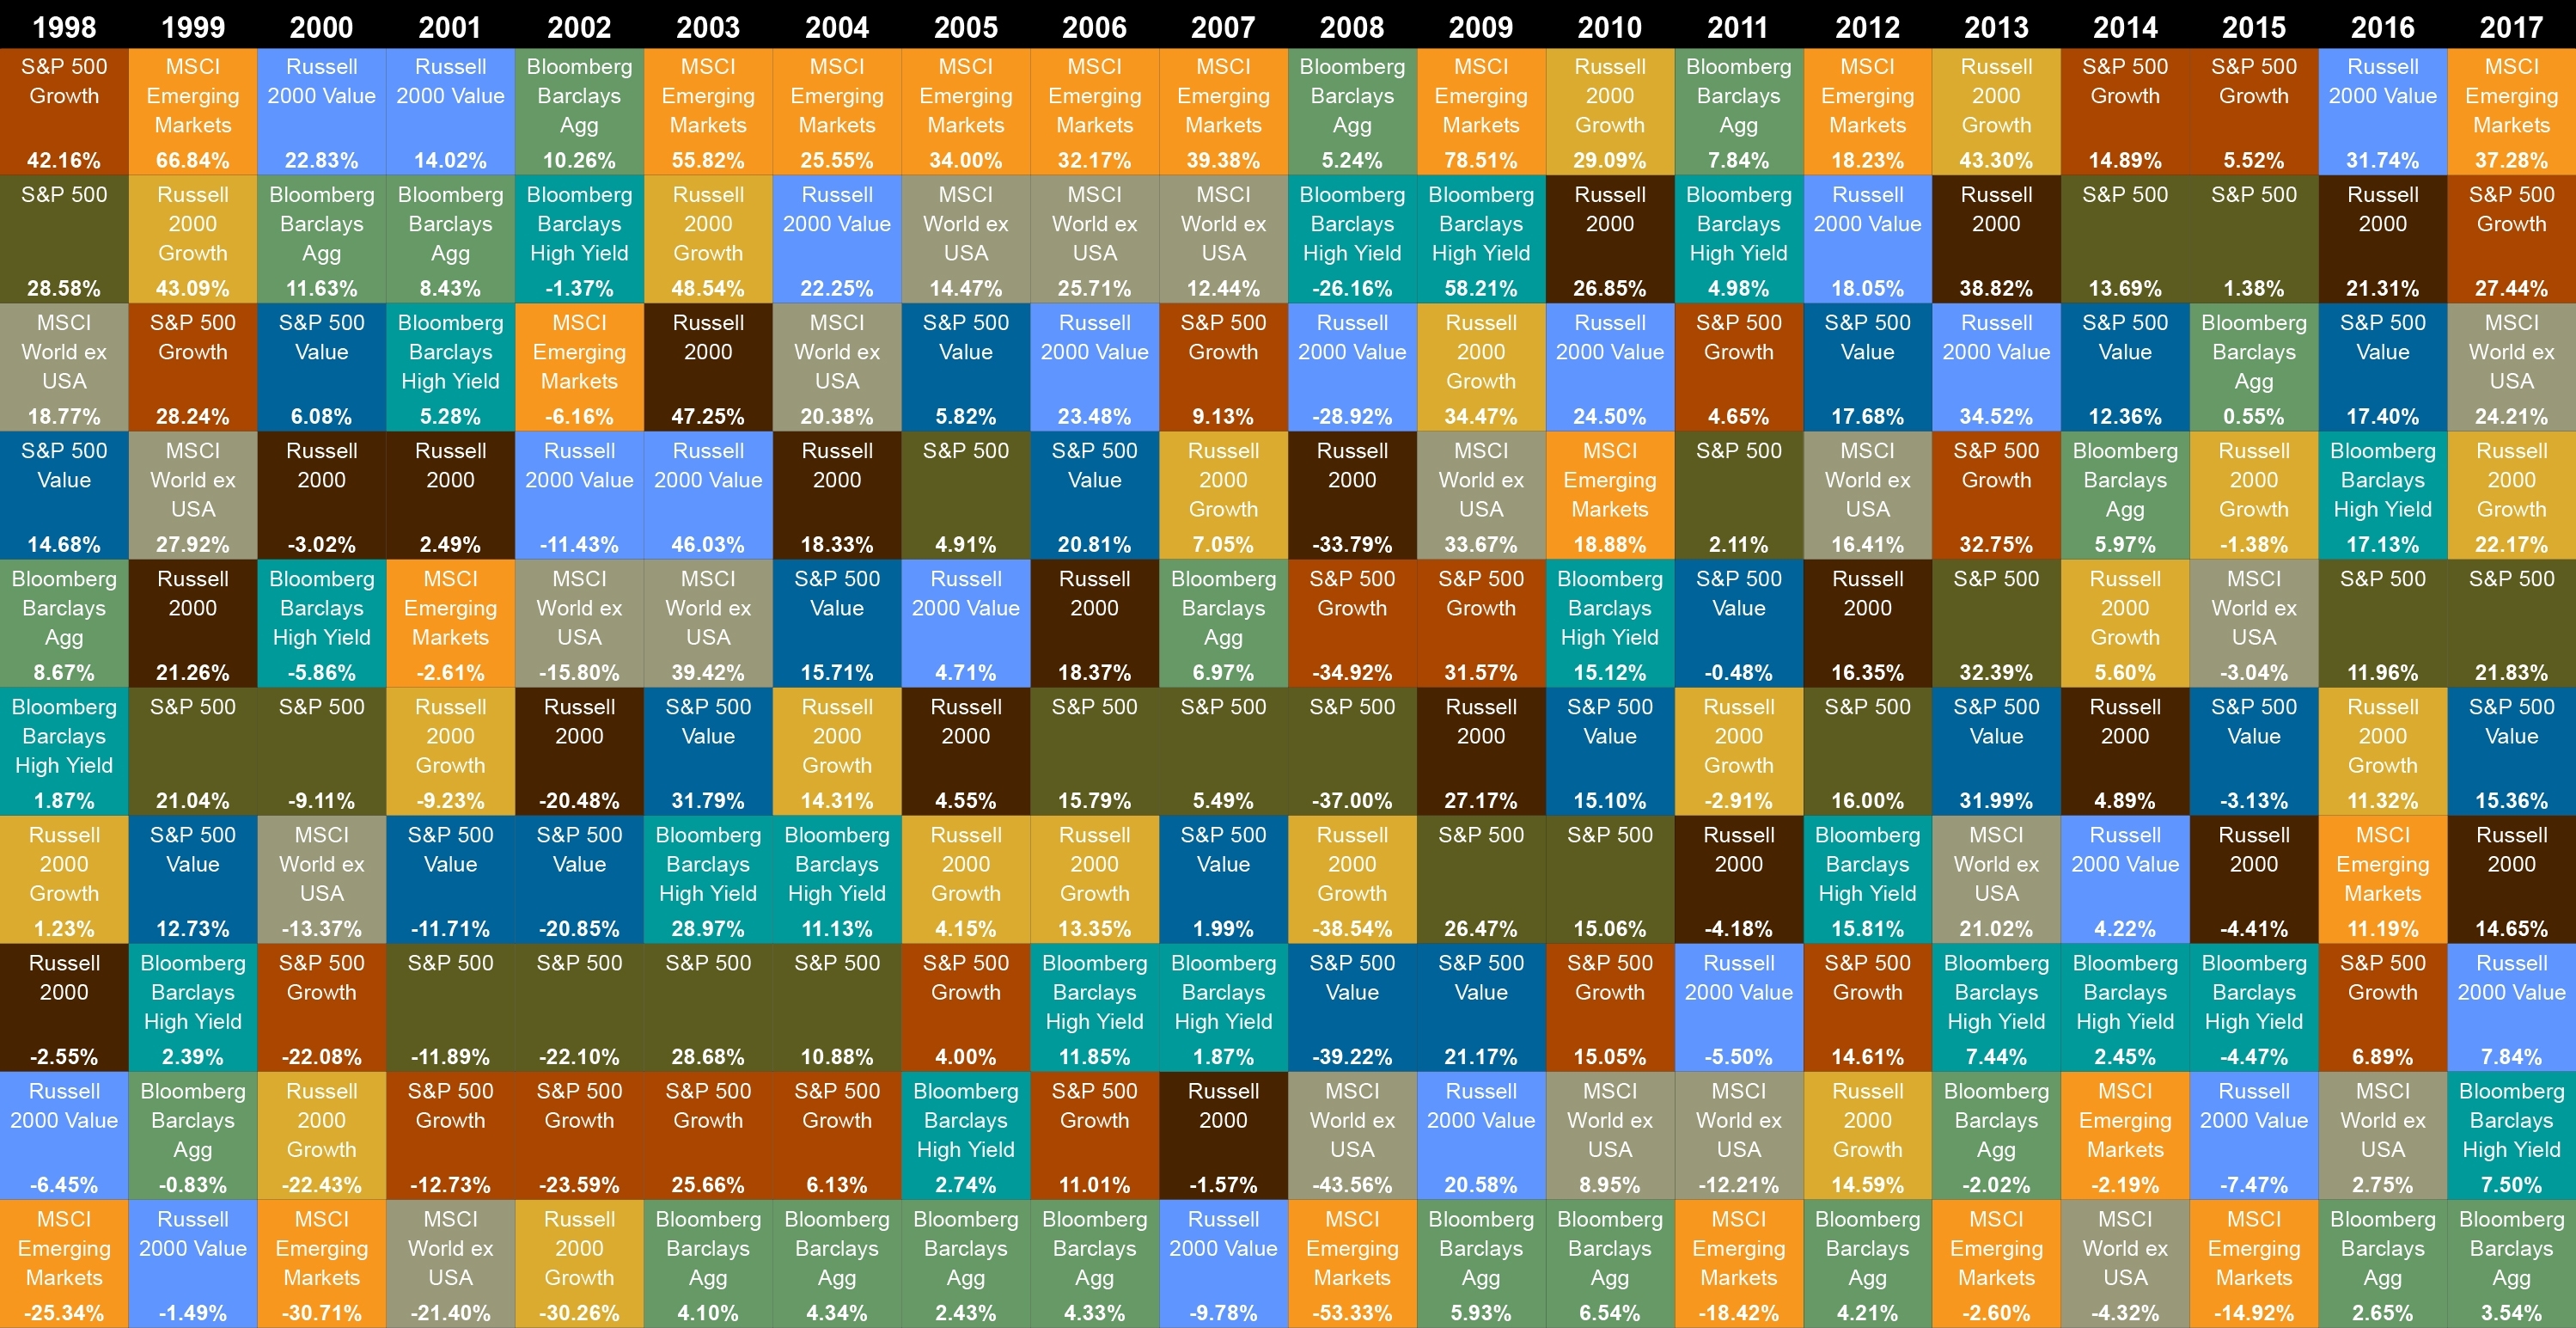
The Callan Periodic Table of Investment Returns is an excellent tool to analyze the returns of various asset classes and the importance of diversification The chart from for the time period 1998 to 2017 is shown below:
Click to enlarge
Source: Callan Associates