The Periodic Table of Total Returns for Asset Classes is hard to find on the internet. The regular Periodic Table by Callan and others based on price returns is widely available online. Since total return is more important just than price returns for long-term investors the following chart is especially fascinating for analyzing returns.
The Periodic Table of Total Returns for various Asset Classes from 2000 to 2017 is shown in the chart below:
Click to enlarge
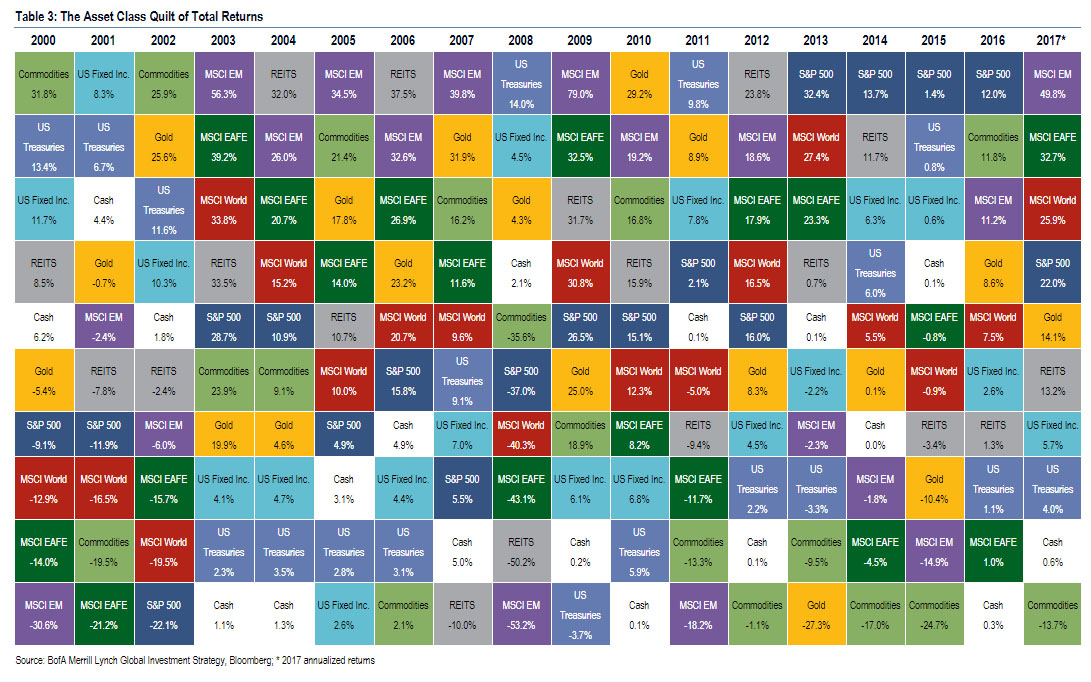
Source: Matasii
For example, in 2016 the S&P price return was 9.84%. However with dividends included the total return was 12%. Similarly the MSCI Emerging index soared by about 50% based on total returns last year.
Related ETF:
- SPDR S&P 500 ETF Trust (SPY)
Disclosure: No positions