The FTSE Straits Times Index (STI) is the benchmark index of the Singapore equity market. The index is a capitalisation-weighted stock market index and tracks the performance of the top 30 companies listed on the Singapore Exchange.
The index is up by over 12% YTD. However it is still down from the peak reached in 2007 before the global financial crisis.
The following chart shows the long-term returns of the Straits Times Index:
Click to enlarge
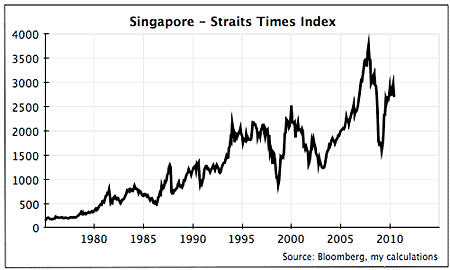
Source: When a bubble is not a bubble, MoneyWeek
The chart below shows the return of the Straits Times Index from 1999 thru April, 2017:
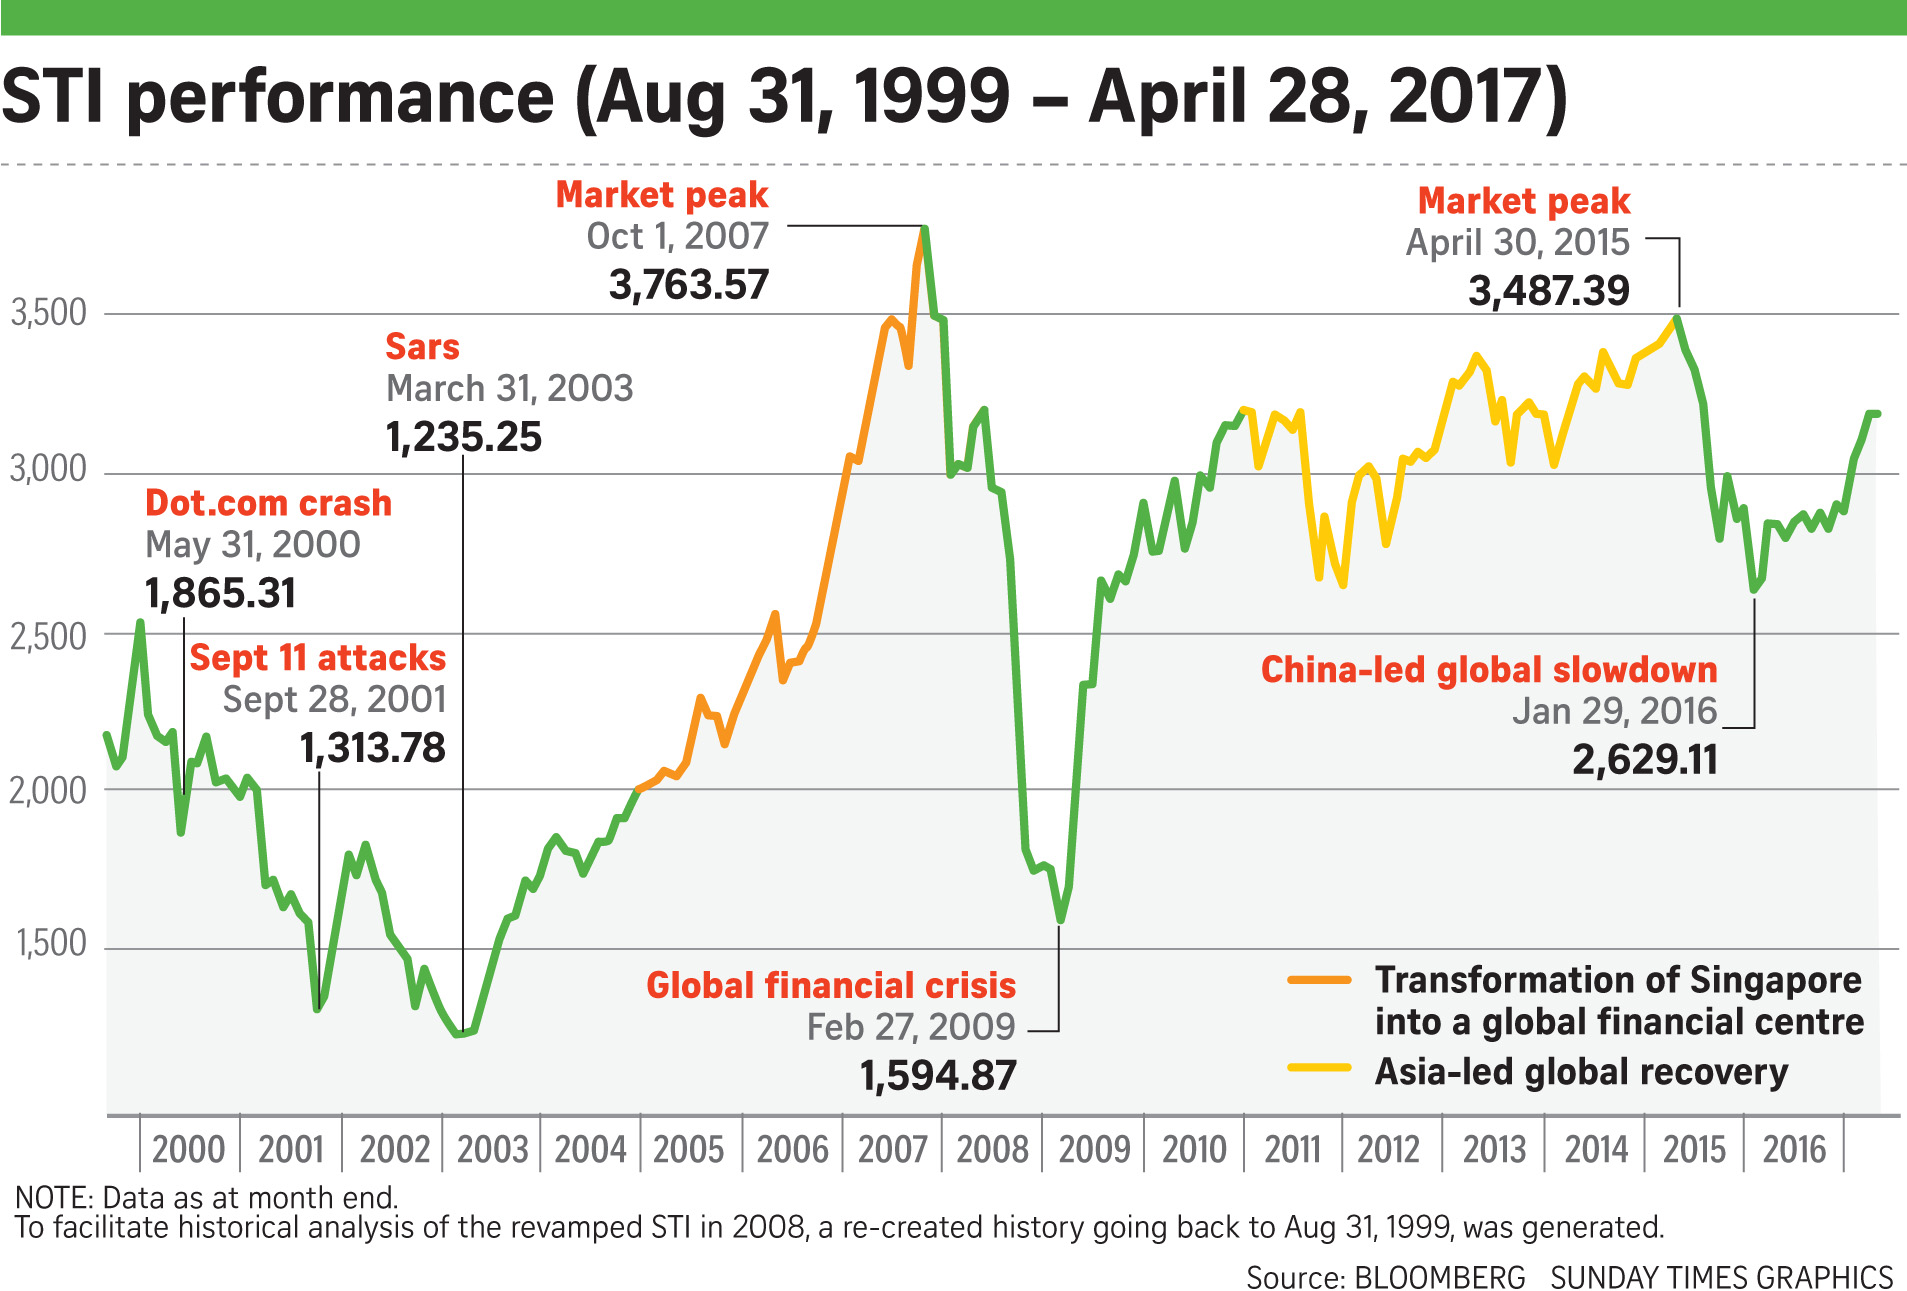
Source:As the Straits Times Index turns 50, three experts weigh in and offer tips for investors, Straits Times
Singapore Stocks Sector Performance 2006 to 2016:
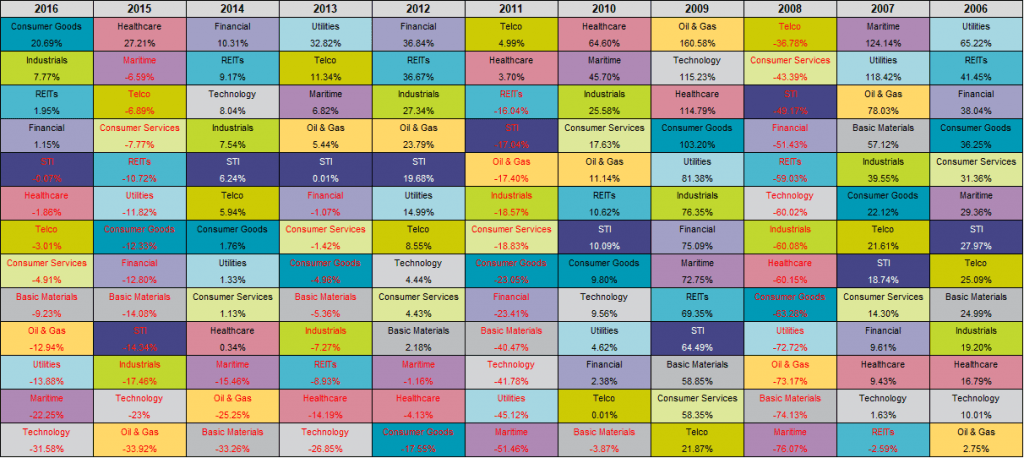
Source: ValueInvestAsia
Related Links:
- Straits Times Index Components (SGX)
- The FTSE Straits Times Index (Wikipedia)
Related ETF:
- iShares MSCI Singapore Index Fund (EWS)
Disclosure: No Positions