I posted the list of The World’s Top 100 Non-Financial MNEs by Foreign Assets 2016 yesterday from the World Investment Report 2017 published by UNCTAD.
In this post, let us take a quick look at the top 100 MNE by foreign assets from transition and developing economies. The attached Excel below also shows how much revenue the top MNEs generate from foreign countries relative to total revenue.
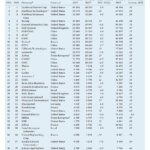
The World’s Top 100 Non-Financial MNEs by Foreign Assets from Transition and Developing Economies in 2015 are shown in the table below:
| Ranking by Foreign Assets | Corporation | Home Economy | Industry | Foreign assets (in millions of dollars) | Total assets (in millions of dollars) |
|---|---|---|---|---|---|
| 1 | CK Hutchison Holdings Limited | Hong Kong, China | Retail Trade | 118 250 | 133 280 |
| 2 | China National Offshore Oil Corp (CNOOC) | China | Mining, quarrying and petroleum | 66 673 | 179 228 |
| 3 | Hon Hai Precision Industries | Taiwan Province of China | Electronic components | 64 040 | 70 244 |
| 4 | Samsung Electronics Co., Ltd. | Korea, Republic of | Communications equipment | 62 294 | 205 860 |
| 5 | Petronas - Petroliam Nasional Bhd | Malaysia | Mining, quarrying and petroleum | 47 912 | 139 868 |
| 6 | China COSCO Shipping Corp Ltd | China | Transport and storage | 43 076 | 55 642 |
| 7 | Vale SA | Brazil | Mining, quarrying and petroleum | 35 338 | 87 251 |
| 8 | China Minmetals Corp | China | Metals and metal products | 35 165 | 107 933 |
| 9 | América Móvil SAB de CV | Mexico | Telecommunications | 34 480 | 74 624 |
| 10 | Tata Motors Ltd | India | Motor Vehicles | 30 589 | 40 646 |
| 11 | Cemex S.A.B. de C.V. | Mexico | Stone, Clay, Glass, and Concrete Products | 26 830 | 31 212 |
| 12 | Hanwha Corporation | Korea, Republic of | Wholesale Trade | 26 326 | 123 783 |
| 13 | China State Construction Engineering Corp Ltd (CSCEC) | China | Construction | 25 472 | 165 740 |
| 14 | Singapore Telecommunications Ltd | Singapore | Telecommunications | 25 309 | 32 410 |
| 15 | New World Development Ltd | Hong Kong, China | Construction | 24 990 | 51 345 |
| 16 | Formosa Plastics Group | Taiwan Province of China | Chemicals and Allied Products | 24 490 | 102 732 |
| 17 | Tencent Holdings Limited | China | Computer and Data Processing | 24 086 | 47 308 |
| 18 | Oil and Natural Gas Corp Ltd | India | Mining, quarrying and petroleum | 23 921 | 53 765 |
| 19 | China National Chemical Corporation (ChemChina) | China | Chemicals and Allied Products | 23 795 | 51 382 |
| 20 | Hyundai Motor Company | Korea, Republic of | Motor Vehicles | 23 450 | 140 568 |
| 21 | Sabic - Saudi Basic Industries Corp. | Saudi Arabia | Chemicals and Allied Products | 22 870 | 87 525 |
| 22 | China National Petroleum Corp (CNPC) | China | Mining, quarrying and petroleum | 22 168 | 622 018 |
| 23 | Sinopec - China Petrochemical Corporation e | China | Petroleum Refining and Related Industries | 21 943 | 362 873 |
| 24 | Legend Holdings Corporation | China | Computer Equipment | 21 164 | 47 220 |
| 25 | CapitaLand Ltd | Singapore | Construction | 20 763 | 33 227 |
| 26 | Sun Hung Kai Properties Ltd | Hong Kong, China | Construction | 20 565 | 77 949 |
| 27 | Wilmar International Limited | Singapore | Food & beverages | 20 548 | 36 926 |
| 28 | Lukoil OAO | Russian Federation | Petroleum Refining and Related Industries | 19 942 | 67 754 |
| 29 | Ooredoo QSC | Qatar | Telecommunications | 19 429 | 25 866 |
| 30 | Etisalat - Emirates Telecom Corp. | United Arab Emirates | Telecommunications | 19 359 | 34 926 |
| 31 | Jardine Matheson Holdings Ltd | Hong Kong, China | Wholesale Trade | 18 809 | 66 581 |
| 32 | Fosun International Limited | China | Metals and metal products | 18 193 | 62 820 |
| 33 | Lenovo Group Ltd | China | Computer Equipment | 17 869 | 24 933 |
| 34 | Sinochem Group | China | Mining, quarrying and petroleum | 17 676 | 54 682 |
| 35 | Genting Bhd | Malaysia | Hotels and restaurants | 17 055 | 20 734 |
| 36 | First Pacific Company Ltd | Hong Kong, China | Food & beverages | 16 425 | 17 199 |
| 37 | Abu Dhabi National Energy Co PJSC (TAQA) | United Arab Emirates | Electricity, gas and water | 16 208 | 29 617 |
| 38 | POSCO | Korea, Republic of | Metals and metal products | 15 161 | 68 350 |
| 39 | Noble Group Ltd | Hong Kong, China | Wholesale Trade | 14 863 | 17 052 |
| 40 | Tata Steel Ltd | India | Metals and metal products | 14 641 | 26 815 |
| 41 | YTL Corporation Bhd | Malaysia | Construction | 14 412 | 17 691 |
| 42 | Naspers Ltd | South Africa | Telecommunications | 14 237 | 16 723 |
| 43 | Dalian Wanda Group | China | Construction | 13 912 | 139 115 |
| 44 | JBS SA | Brazil | Agriculture, forestry, & fishing | 13 787 | 30 932 |
| 45 | DP World Limited | United Arab Emirates | Transport and storage | 13 742 | 20 259 |
| 46 | Sasol Limited | South Africa | Chemicals and Allied Products | 13 402 | 30 370 |
| 47 | Quanta Computer Inc | Taiwan Province of China | Computer Equipment | 13 367 | 16 176 |
| 48 | Gazprom JSC | Russian Federation | Mining, quarrying and petroleum | 13 337 | 230 119 |
| 49 | Shangri-La Asia Ltd | Hong Kong, China | Hotels and restaurants | 13 047 | 13 285 |
| 50 | Bharti Airtel Limited | India | Telecommunications | 12 527 | 34 070 |
| 51 | Fomento Economico Mexicano SAB | Mexico | Food & beverages | 11 985 | 23 561 |
| 52 | Gerdau SA | Brazil | Metals and metal products | 11 941 | 17 699 |
| 53 | MTN Group Ltd | South Africa | Telecommunications | 11 634 | 20 156 |
| 54 | Hindalco Industries Ltd | India | Metals and metal products | 11 162 | 21 155 |
| 55 | Infosys Limited | India | Computer and Data Processing | 11 116 | 11 379 |
| 56 | China Mobile Limited | China | Telecommunications | 11 008 | 220 167 |
| 57 | CLP Holdings Ltd | Hong Kong, China | Electricity, gas and water | 10 823 | 26 317 |
| 58 | Tata Consultancy Services | India | Computer and Data Processing | 10 818 | 13 448 |
| 59 | Doosan Corp | Korea, Republic of | Electronic components | 10 730 | 26 824 |
| 60 | Axiata Group Bhd | Malaysia | Telecommunications | 10 613 | 13 011 |
| 61 | Flex Ltd | Singapore | Electronic components | 10 570 | 12 385 |
| 62 | Mobile Telecommunications Company KSC (Zain) | Kuwait | Telecommunications | 10 541 | 11 512 |
| 63 | Sonatrach e | Algeria | Mining, quarrying and petroleum | 10 383 | 103 830 |
| 64 | Broadcom Limited | Singapore | Electronic components | 10 287 | 10 592 |
| 65 | China Electronic Information Industry Group Co., Ltd. (CEC) | China | Computer and Data Processing | 10 239 | 38 205 |
| 66 | Cofco Corp | China | Food & beverages | 10 195 | 70 682 |
| 67 | Keppel Corp Ltd | Singapore | Other Transportation Equipment | 9 935 | 20 423 |
| 68 | San Miguel Corp | Philippines | Food & beverages | 9 922 | 26 599 |
| 69 | Petroleo Brasileiro SA | Brazil | Mining, quarrying and petroleum | 9 899 | 227 284 |
| 70 | WH Group Limited | Hong Kong, China | Agriculture, forestry, & fishing | 9 573 | 14 301 |
| 71 | Reliance Industries Limited | India | Petroleum Refining and Related Industries | 9 293 | 92 484 |
| 72 | Grupo Bimbo SAB de CV | Mexico | Food & beverages | 9 014 | 11 491 |
| 73 | Sime Darby Bhd | Malaysia | Wholesale Trade | 8 819 | 16 508 |
| 74 | Pou Chen Corp | Taiwan Province of China | Textiles, clothing and leather | 8 442 | 8 540 |
| 75 | Mediclinic International PLC | South Africa | Health care services | 8 290 | 9 419 |
| 76 | Petróleos de Venezuela SA | Venezuela, Bolivarian Republic of | Mining, quarrying and petroleum | 8 122 | 201 943 |
| 77 | Golden Agri-Resources Ltd | Singapore | Food & beverages | 8 036 | 8 036 |
| 78 | Olam International Ltd | Singapore | Food & beverages | 7 191 | 14 683 |
| 79 | Wistron Corp | Taiwan Province of China | Computer Equipment | 7 183 | 8 837 |
| 80 | China Communications Construction Company Ltd | China | Construction | 7 131 | 112 721 |
| 81 | Galaxy Entertainment Group Ltd | Hong Kong, China | Hotels and restaurants | 7 049 | 7 142 |
| 82 | Ternium SA | Argentina | Metals and metal products | 6 982 | 8 063 |
| 83 | Shenzhen International Holdings Limited | Hong Kong, China | Transport and storage | 6 889 | 7 612 |
| 84 | Aspen Pharmacare Holdings Limited | South Africa | Pharmaceuticals | 6 712 | 8 298 |
| 85 | Alfa, S.A.B. de C.V. | Mexico | Metals and metal products | 6 694 | 15 351 |
| 86 | Sembcorp Industries Limited | Singapore | Electricity, gas and water | 6 638 | 14 064 |
| 87 | China Resources Beer (Holdings) Company Limited | Hong Kong, China | Retail Trade | 6 586 | 6 587 |
| 88 | Guangdong Investment Ltd | Hong Kong, China | Electricity, gas and water | 6 574 | 6 982 |
| 89 | Compal Electronics Inc | Taiwan Province of China | Computer Equipment | 6 535 | 9 979 |
| 90 | Banpu Public Company Limited | Thailand | Mining, quarrying and petroleum | 6 499 | 6 553 |
| 91 | City Developments Ltd | Singapore | Real Estate | 6 440 | 14 348 |
| 92 | LG Electronics Inc. | Korea, Republic of | Electric equipment | 6 429 | 30 868 |
| 93 | Grupo Mexico, S.A. de C.V. | Mexico | Mining, quarrying and petroleum | 6 207 | 22 254 |
| 94 | Li & Fung Ltd | Hong Kong, China | Wholesale Trade | 5 966 | 7 933 |
| 95 | Mexichem SAB de CV | Mexico | Rubber and Miscellaneous Plastic Products | 5 772 | 8 670 |
| 96 | Embraer - Empresa Bras De Aeronautica SA | Brazil | Aircraft | 5 497 | 11 506 |
| 97 | BRF S.A. | Brazil | Agriculture, forestry, & fishing | 4 954 | 10 198 |
| 98 | Gold Fields Ltd | South Africa | Mining, quarrying and petroleum | 4 892 | 5 878 |
| 99 | HNA Group Co Ltd | China | Transport and storage | 4 767 | 95 339 |
| 100 | SK Hynix Inc | Korea, Republic of | Electronic components | 4 708 | 25 227 |
Source: World Investment Report 2017, UNCTAD
Two observations:
- Firms from China dominates the above list. This is not surprising since China is the largest developing economy.
- Gazprom(OGZPY) and Lukoil (LUKOY) the only Russian firms that appear in this ranking are from the energy industry.
Download: The World’s Top 100 Non-Financial MNEs by Foreign Assets from Transition and Developing Economies 2016(in Excel)
Disclosure: No Positions
There is a mistake at the bottom. Or rather the whole page is misleading. It is written “Download: The World’s Top 100 Non-Financial MNEs by Foreign Assets from Transition and Developing Economies 2016(in Excel)” but when I click the link, it gives me data of 2015 instead of 2016.
Thanks for the note.
I will look into this tomorrow morning and fix it.
-David