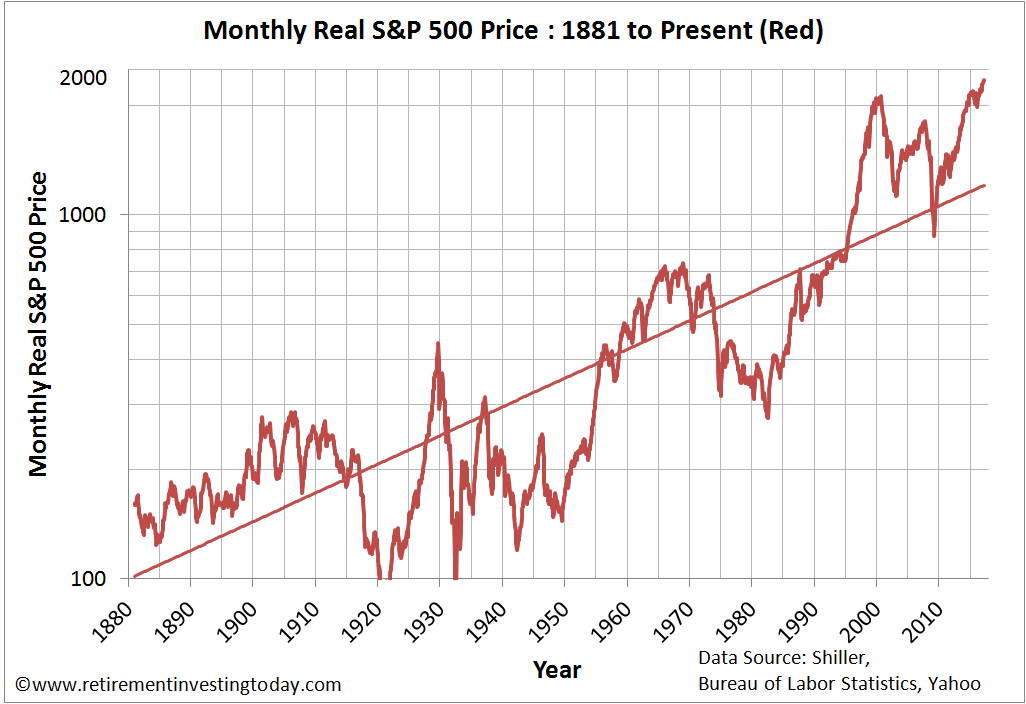
The S&P 500 closed at 2,402.32 on price basis today. Year-to-date the index is up a decent 7.30%. In the past 10 years it has grown by 4.81%. Over the long run the index has beat inflation. The Monthly Real Return of S&P 500 from 1881 thru March, 2017 is shown below:
Click to enlarge
Source: Keep calm and carry on, Retirement Investing Today
Though it is very rare for investors to hold stocks over 100 years, the above chart shows that in the long-run the US market as measured by the benchmark S&P 500 goes higher.
Related ETF:
- SPDR S&P 500 ETF (SPY)
Disclosure: No Positions
