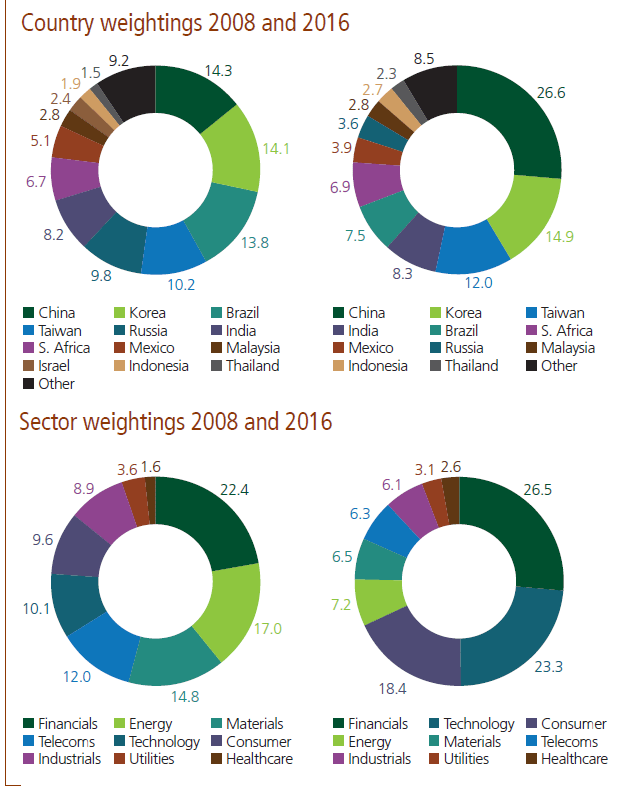
The widely used benchmark for emerging markets from provider MSCI has changed substantially in recent years. As emerging markets evolve the index weightings changes accordingly.
The graphic below shows the comparison of country and sector weights of the MSCI Emerging Markets Index in 2008 and 2016:
Click to enlarge
Source: Active Viewpoint: Global Emerging Markets, Martin Currie
Financials have maintained about the same allocation in 2008 and 2016 but materials and energy sector weights have declined in the index. However the weighing of the technology sector rose 130% between the years.
MSCI Emerging Markets Index Composition in Jan, 2017:
Click to enlarge
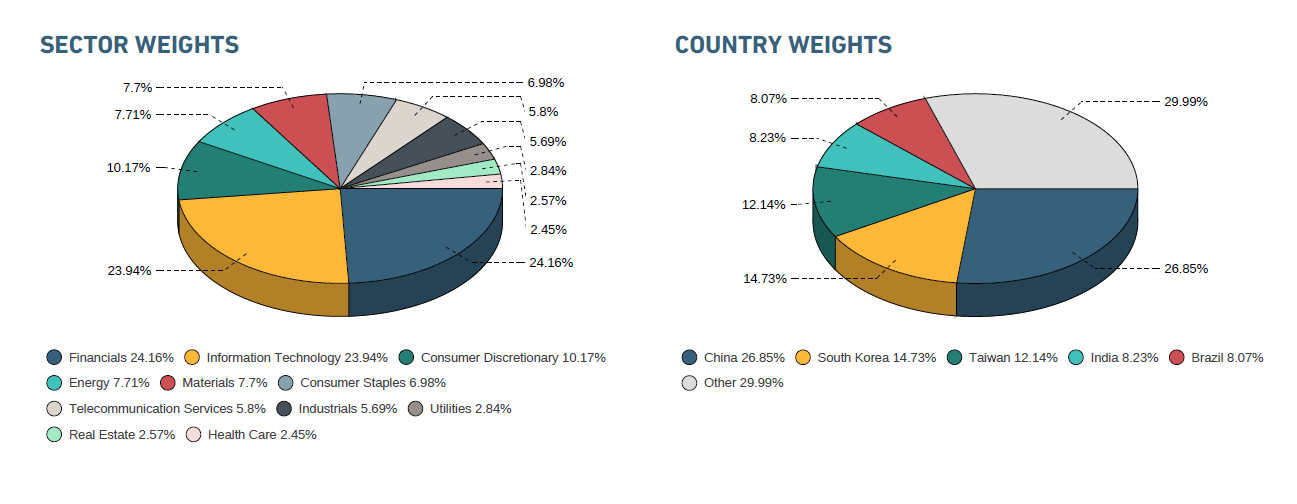
Source: MSCI
Energy and Materials still amount to about 7% of the index allocations.
The key takeaway is that developing countries are no more just for commodities and natural resources. Since these countries continue to develop some sectors will become more important and larger than others. According investors must adjust their portfolio allocations.
Related ETFs:
Disclosure: No Positions
Update (11/28/17):
Click to enlarge
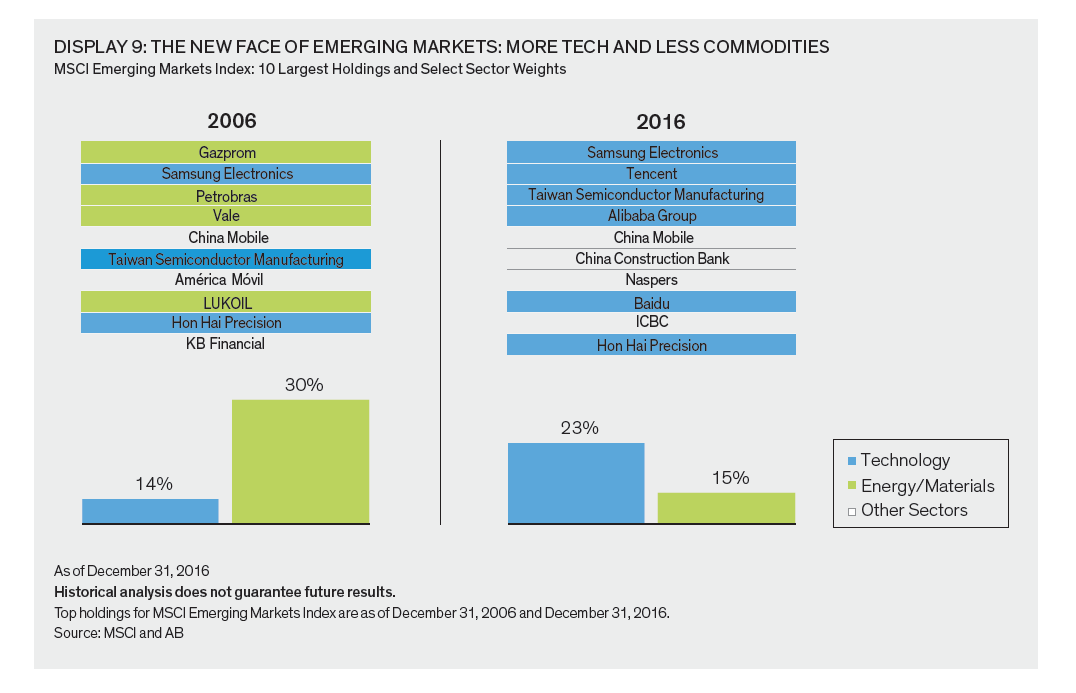
Source: Broaden your horizons, Alliance Bernstein, Oct, 2017