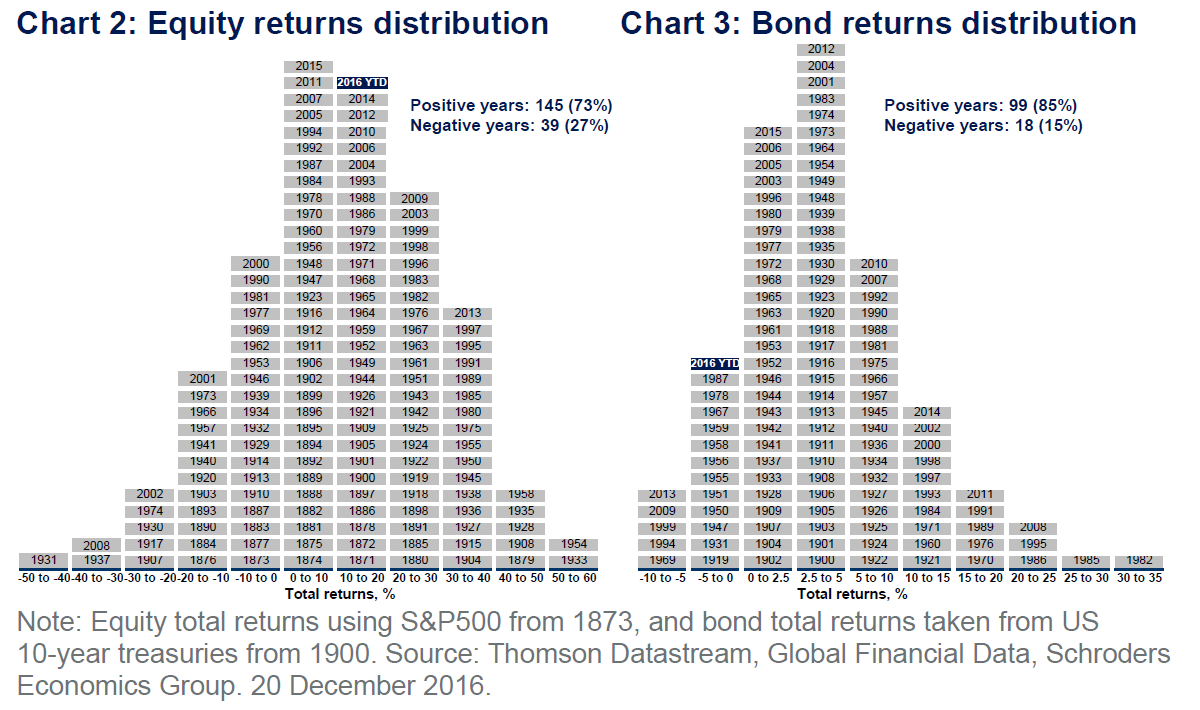
The S&P 500 Total Returns since 1873 and US Treasury Total Returns from 1900 are shown in the chart below:
Click to enlarge
Source: Schroders Economic and Strategy Viewpoint, Jan 2017, Schroders
In 2016, US stocks earned an above-average return when compared to their historical returns. U.S. treasuries on the other hand had their 17th worst year since 1900.
The above chart also shows over the long-term, equities as measured by the S&P 500 earned a positive return in more years than negative return. Or stocks earned a positive return in 73% of the years since 1873. So while most people will not own stocks for such a long period, it does however show that if stocks are held over many years one can earn a positive total return.
Update:
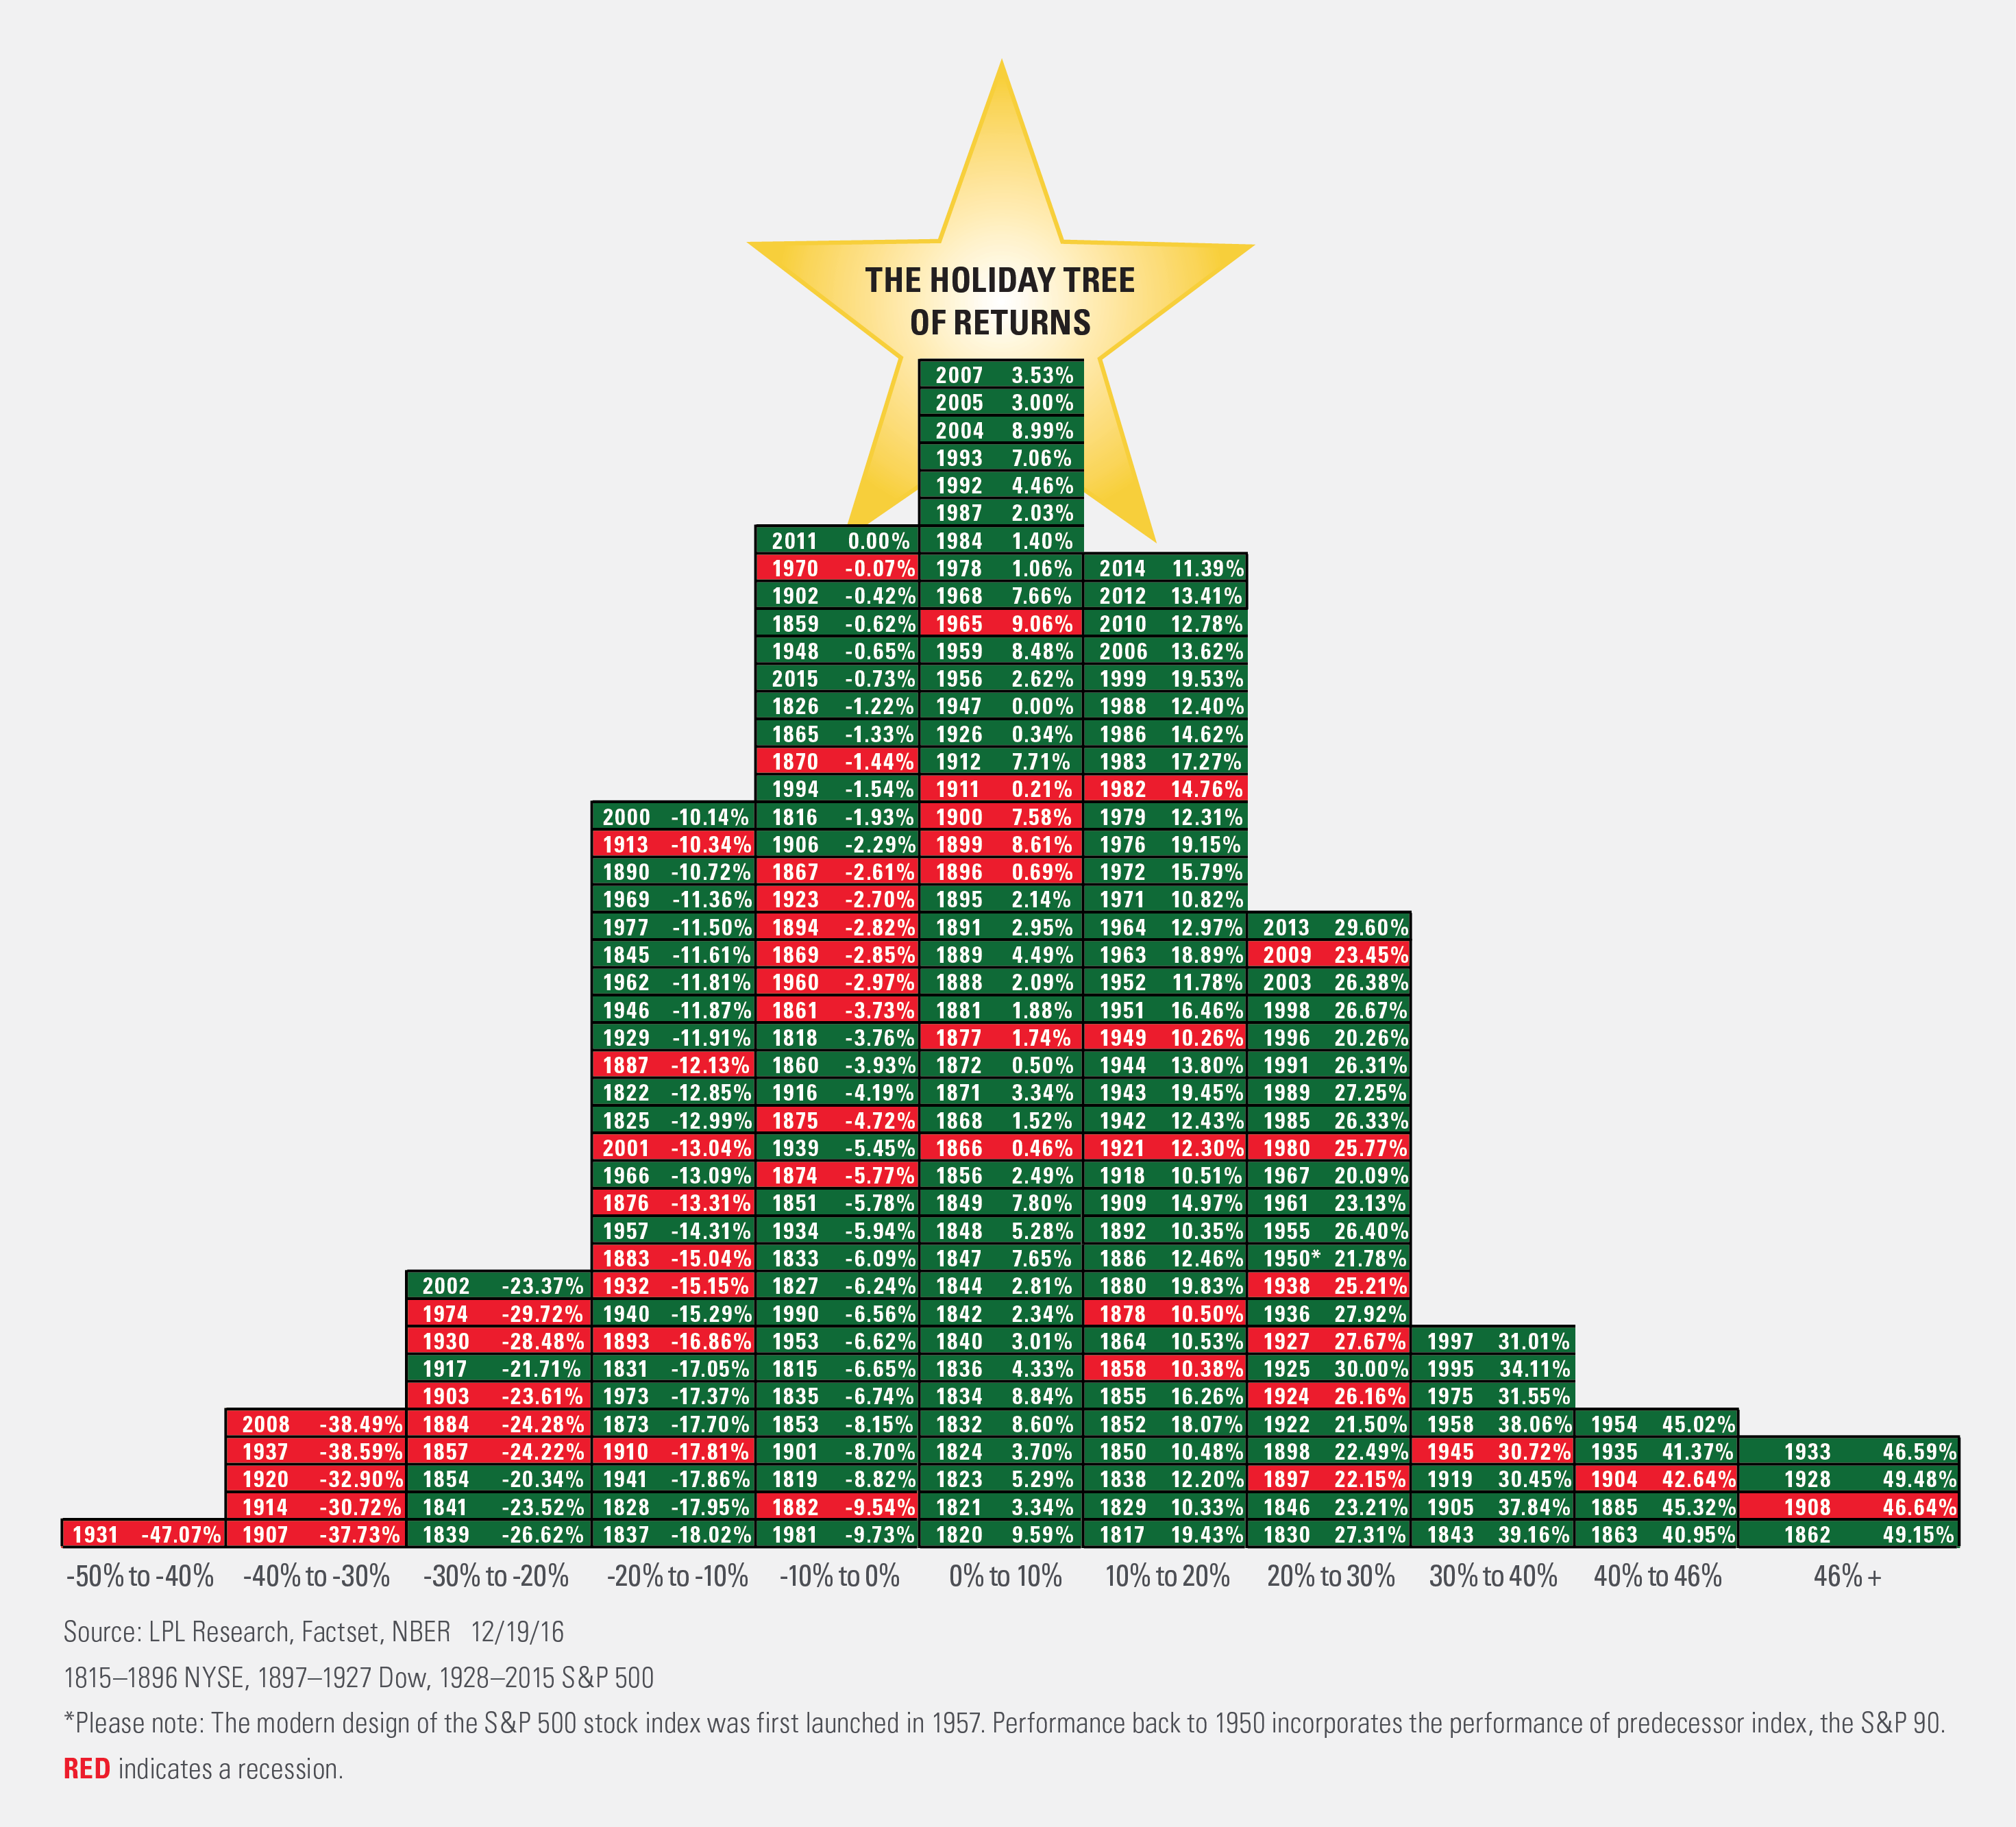
The Holiday Tree of Returns for the S&P 500
Click to enlarge
Source: LPL Financial
Hat Tip: The Big Picture
Related ETFs:
Disclosure: No Positions