Yesterday we looked at the importance of long-term investing using the UK edition of The Vanguard 2016 Index Chart. The Australian edition of The Vanguard 2016 Index Chart below shows how long-term investing produces the most returns with equity investing:
Click to enlarge
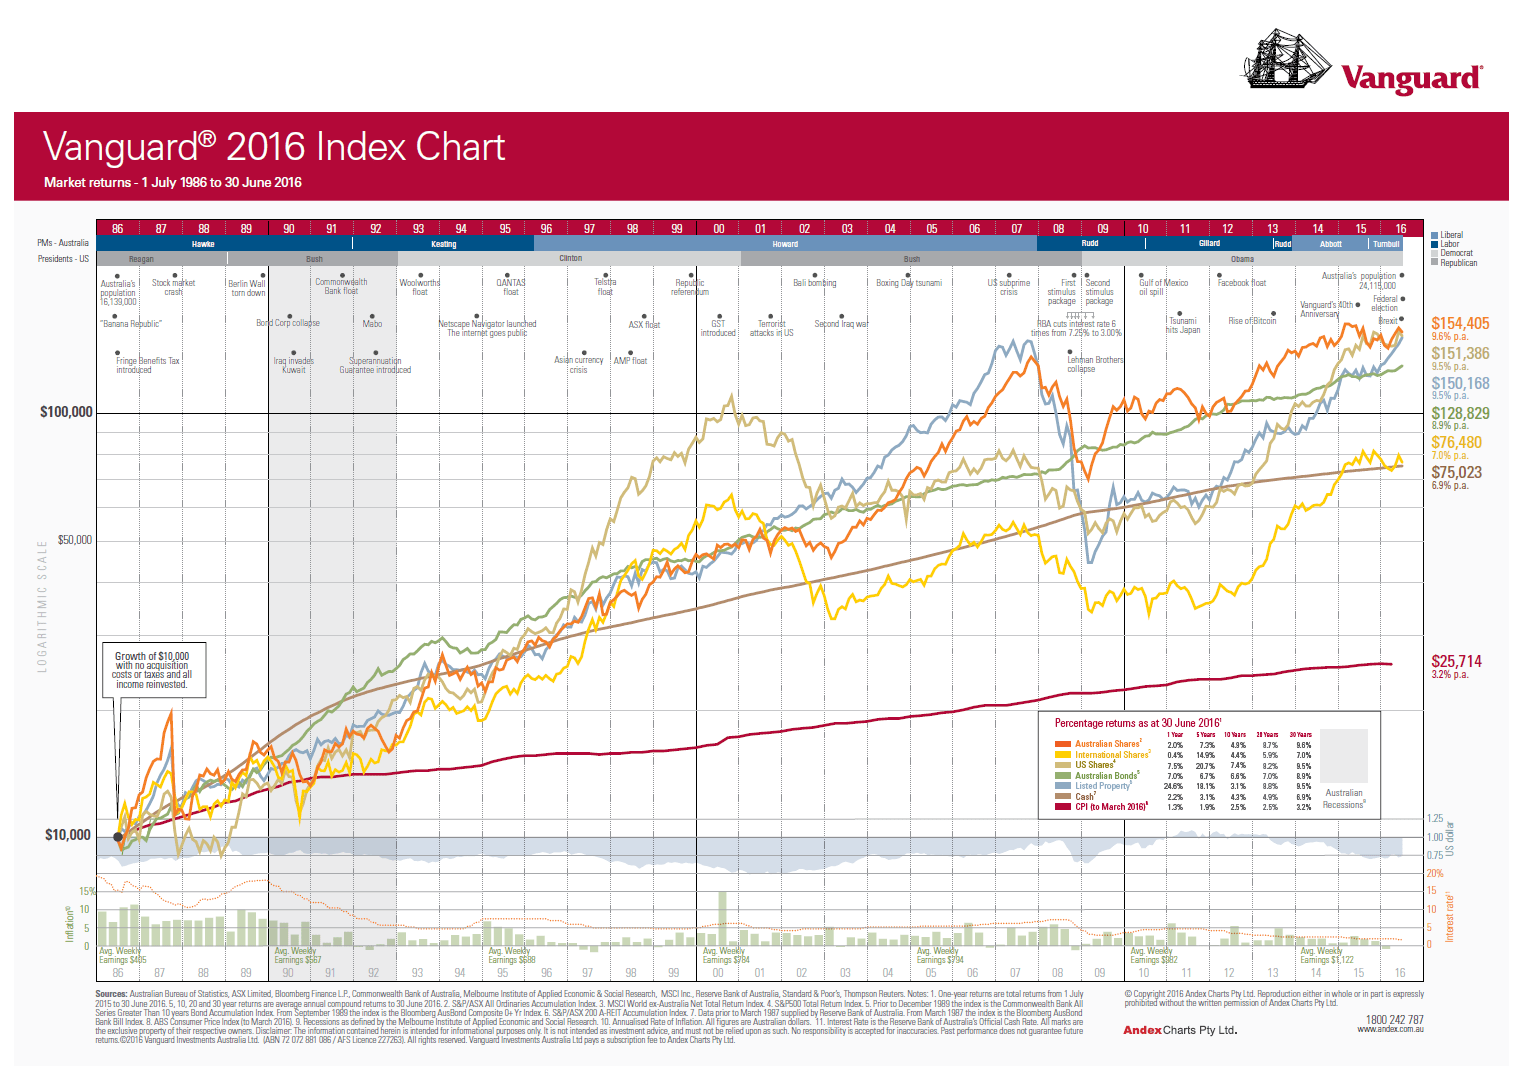
A A$10,000 investment in 1986 would have produced an annual return of 9.6% beating all other asset classes shown.
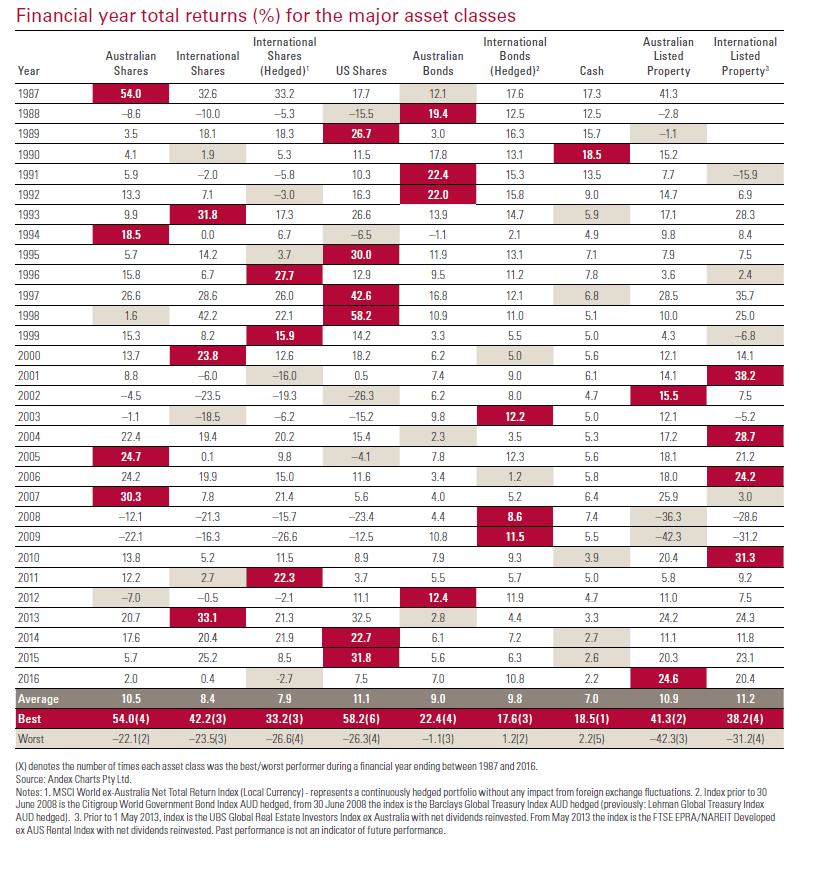
The financial year total returns for the asset types shown in the above chart:
Source: The bigger picture – The Vanguard 2016 Index Chart, Vanguard Australia
Download: The bigger picture – The Vanguard 2016 Index Chart (Australian Edition in pdf)
Related ETFs:
- SPDR S&P 500 ETF (SPY)
- Vanguard Dividend Appreciation ETF (VIG)
- iShares MSCI Emerging Markets ETF (EEM)
- Vanguard MSCI Emerging Markets ETF (VWO)
- iShares MSCI Australia ETF (EWA)
Disclosure: No Positions