The US Unemployment Rate has been on the decline for many months now. But the Labor Force Participation Rate has also been declining. The unemployment rate stood at just 4.9% in October and the number of unemployed persons was 7.8 million according to the official data from BLS.
The labor force participation rate at 67.3% in early 2000. Since then the rate has dropped and reached 62.7% in mid-2016. The chart below shows the slow and steady downward trend:
Click to enlarge
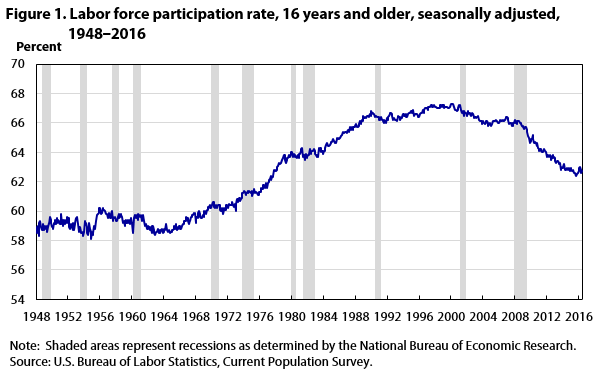
Source: BLS
Higher labor participation rates implies more people able to work are employed. In general, the higher this rate the better for the economy.
So how does a chart look like when we plot the unemployment rate against labor force participation rate?
Click to enlarge
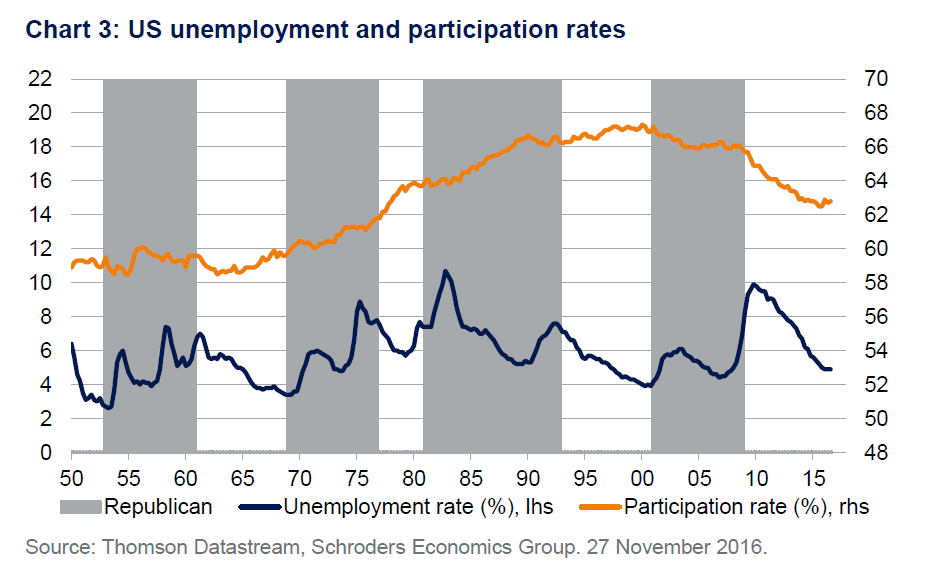
Source: Schroder’s
The above chart shows that both the rates have decreased. The official unemployment is very low because of the methodology used to calculate that figure. For example, any unemployed person who has given up looking for a job are not counted. So these are the “missing” unemployed workers who fall off the radar. So the real unemployment rate is much higher.
The labor force participation rate an decrease for many reasons including lesser women wanting to be in the work force. But the chart showing the decline is stepper and repeats year after year. This should a cause for concern for policy makers.