One of the important strategies for success in building wealth with equities is to identify and own the right the stock in an industry. Owning the average or poor player in an industry will lead to lower returns for investors. In this post, let’s put this logic to test.
US-based Procter & Gamble Company (PG) is a giant in the consumer staples sector. Some of its competitors are Colgate-Palmolive Company(CL), Kimberly Clark Corp (KMB) and Unilever N.V(UN).
In terms of stock performance, PG has under-performed the above competitors in the past 10 years as shown in the chart below:
Click to enlarge
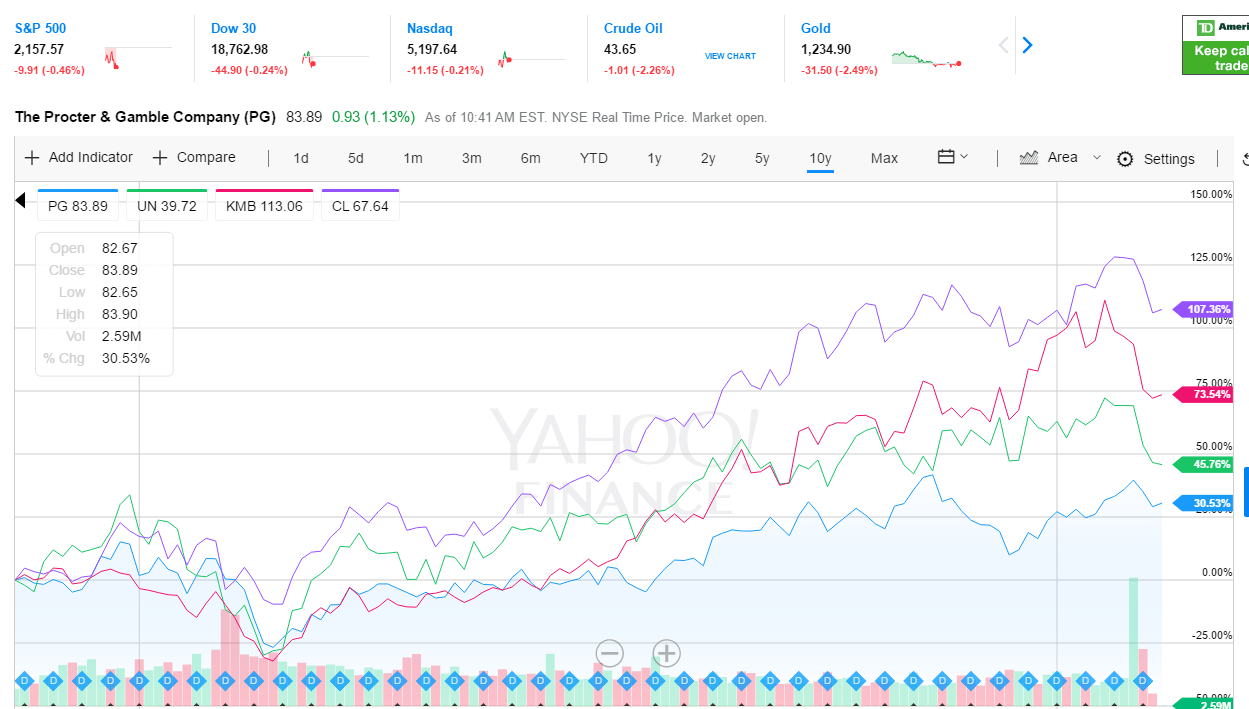
Note: Data shown above are as of Nov 11, 2016
Source: Yahoo Finance
A few observations about Procter & Gamble:
- PG returned 30% in terms of price appreciation in 10 years. Competitors CL, KMB and UN on the other hand yielded returns of 107%, 73% and 45% respectively. An investment in Unilever would have earned more than 50% returns than that of P&G’s return. The other two companies performed even better.
- While all three- PG, CL and KMB are American firms, owning the right company increased the return earned by an investor was much higher in the the long-run.
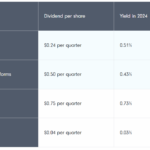
- In terms of dividend yields, PG currently yields 3.23%. CL, KMB and UN have dividend yields of 2.32%, 3.28% and 3.51% respectively.
- PG has the largest market cap among these firms with a market cap of over $223.0 billion. However in terms of stock return especially in the long-run bigger size does not necessarily mean better returns.
- Since 1970, PG stock has had 6 splits with the last 2 for 1 in 2004. An investment of $10,000 in PG stock 10 years ago would have grown to $17,673.35 as of Nov 10, 2016 for an average annual return of 5.86% according to stocksplithistory.com site. In 10 years the investment had a Total Return of 76%. Basically even in a decade the original investment did not double.
Click to enlarge
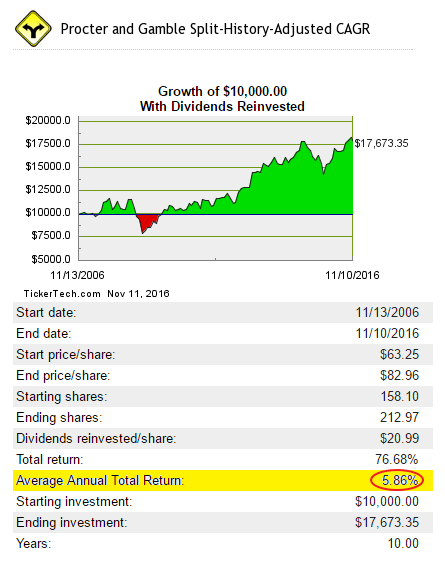
Source: stocksplithistory.com
However its peers fared as noted below during the same time period:
CL:
Total Return – 161%
Average Annual Total Return – 10.08%
KMB:
Total Return – 152%
Average Annual Total Return – 9.70%
UN:
Total Return – 116%
Average Annual Total Return – 8.03%
The reasons for the poor performance for PG are many.Some of them are incompetent management, lack of innovation, bad acquisitions, giant bureaucracy, etc.
Also checkout:
- Procter & Gamble (PG) Dividend Stock Analysis 2016 (Dividend Growth Investor)
Disclosure: No positions