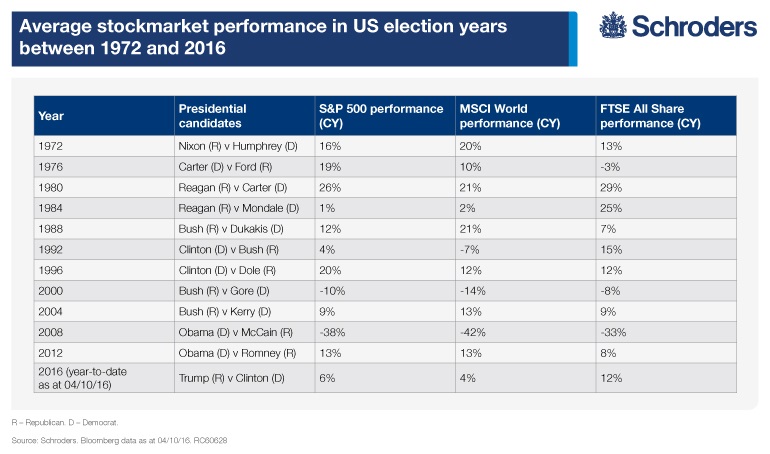
Stock markets in the US and the world generally tend to perform well in US election years Historical data analyzed by Schroders shows the S&P 500 rose in 9 out of the 11 election years. The MSCI World and FTSE All Share indices gained in eight of the 11 years.
Chart – Average Performance of S&P 500, MSCI World and FTSE All Share in US Election Years :
Click to enlarge
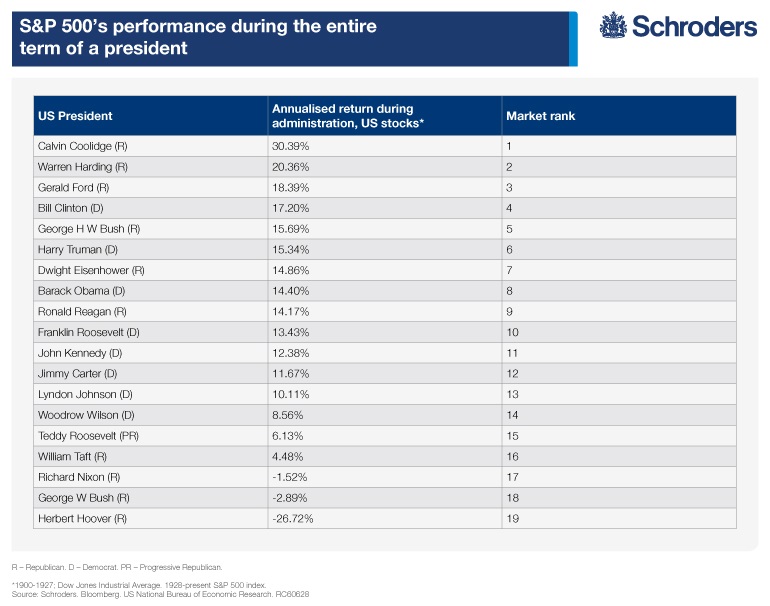
In addition, as I have written before S&P 500 outperformed in US election years when the Democrats won. However no clear trend emerges when we look at the performance during the entire term of a President as shown in the table below:
Source: Are presidential elections good for US and global stockmarkets?, Schroders
The key takeaway here is that it is not possible to predict how markets will perform whether the elected President is a Democrat or a Republican. So investors are better off not worrying about the elections and focus on their long-term strategy for investment success. In fact, investors willing to deploy capital can take advantage of the current market volatility due to the fear of Trump,a Republican nominee taking the White House and add high-quality stocks at cheaper prices.
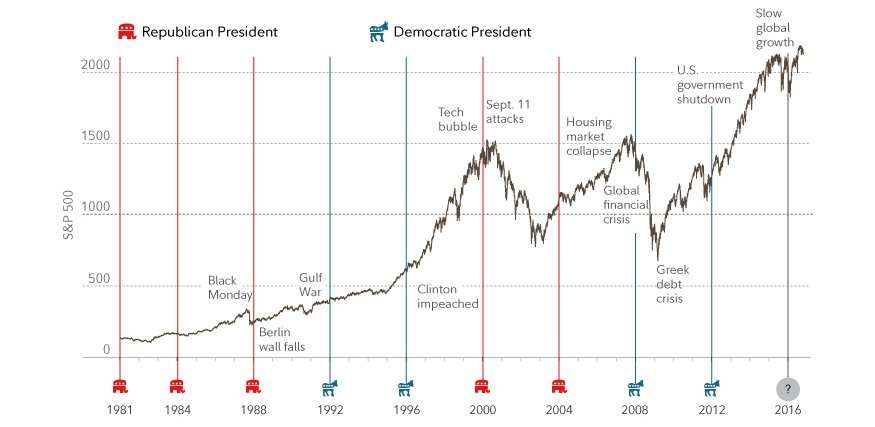
A long-term investment strategy pays off as shown in the chart below:
Click to enlarge
xx
Source: Will the election impact your investments?, Fidelity
Also see: US GDP Growth: Democratic vs. Republican Presidents, TFS
Related ETFs:
Disclosure: No positions
