The Callan Periodic Table of Investment Returns for various Emerging Market indices from 2006 to 2015 are shown in the chart below:
Click to enlarge
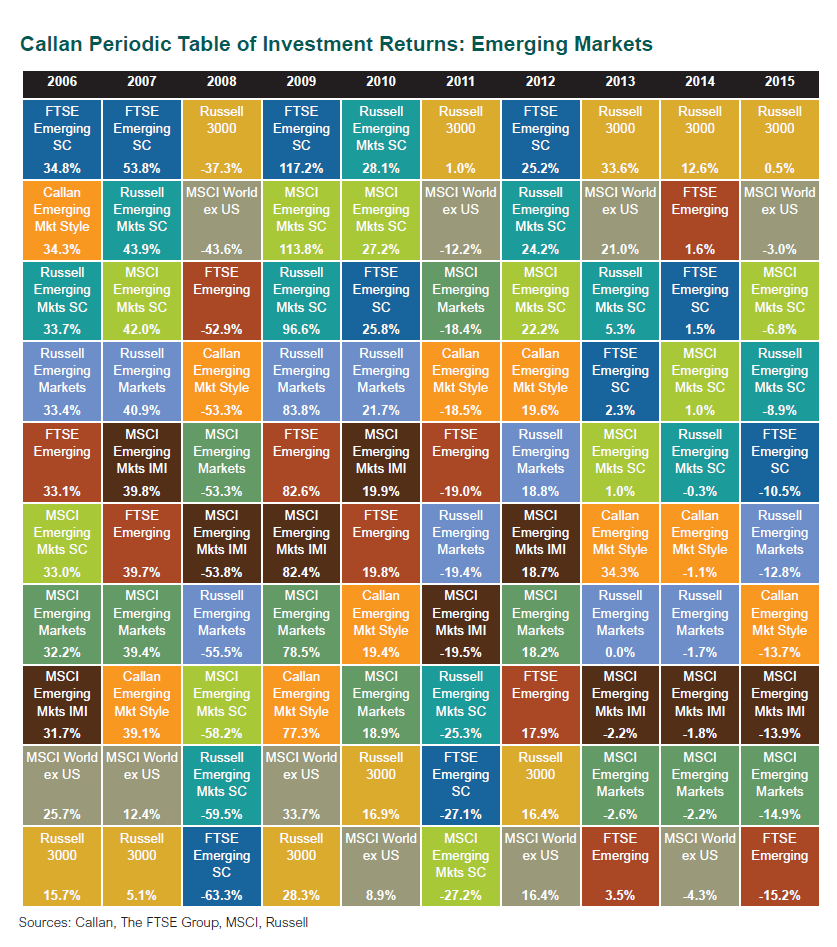
Source: Callan Associates
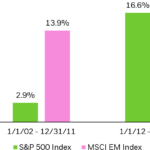
Emerging markets are hot this year with many markets having soared by double digit percentages so far. These markets were also the top performers before the Global Financial Crisis of 2008-09. The widely followed MSCI Emerging Markets Index rose by 32% and 39% in 2006 and 2007 respectively. However in more recent years emerging stocks have let down investors with their poor returns. In 2013, 2014 and 2015 emerging stocks as represented by the MSCI Emerging Markets Index lost money.
Investing in emerging markets is not suitable for all investors. Even investors who can stomach the gut-wrenching rides should allocate only a small portion of their assets to these markets. As in other markets, small caps get crushed more in market downturns than large caps. The FTSE Emerging Markets Small Cap Index (“FTSE Emerging SC” shown above in blue) crashed 63% in 2008.
Related ETF:
Disclosure: No Positions
Related: The Callan Periodic Table of Investment Returns 2016: A Review