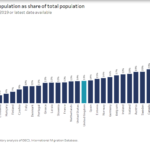
The U.S. defense spending is the highest in the world. In fact, the amount spent each year is more than the combined military expenditures of the next few countries.
According to the National Priorities Project, US taxpayers paid $528.49 billion for the Department of Defense. Unlike allocations to other areas, allocations to the military in the Federal budget is usually not given much thought by the Congress. The National Priorities Project questions if the country is making the right choices in allocating high portion of the annual budget to defense.
Here is how a dollar paid by taxpayers is spent by the state:
Click to enlarge
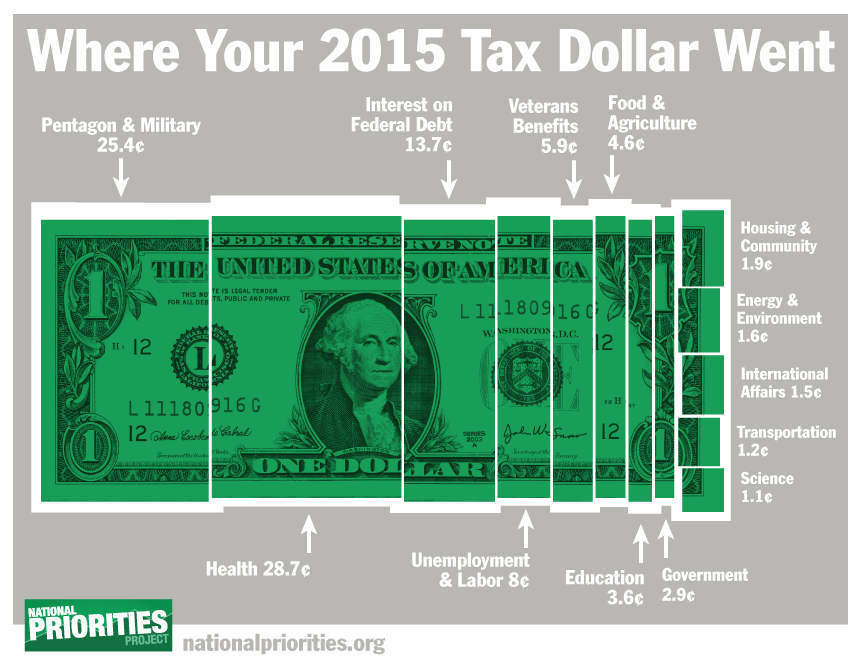
Source: National Priorities Project
After health spending, the second highest allocation goes to defense. This is not surprising since the military is huge and it takes a lot of money to maintain a world-class military. However some have argued that one way to reduce the burden on American taxpayers is to shift the costs to some of the allies such as Germany South Korea, etc. This way American taxpayers do not have end up footing the bill, for example, to protect South Koreans from a North Korean invasion or Germans from Russia. Countries such as Germany and South Korea are wealthy enough to be able to pay the cost of protection.
The billions of dollars spent on defense could have paid for the following instead:
6.54 million Elementary School Teachers for 1 Year, or
7.13 million Clean Energy Jobs Created for 1 Year, or
9.51 million Infrastructure Jobs Created for 1 Year, or
5.28 million Jobs with Supports Created in High Poverty Communities for 1 Year, or
62.58 million Head Start Slots for Children for 1 Year, or
51.15 million Military Veterans Receiving VA Medical Care for 1 Year, or
15.91 million Scholarships for University Students for 4 Years, or
22.72 million Students Receiving Pell Grants of $5,815 for 4 Years, or
222.93 million Children Receiving Low-Income Healthcare for 1 Year, or
595.33 million Households with Wind Power for 1 Year, or
148.46 million Adults Receiving Low-Income Healthcare for 1 Year, or
367.73 million Households with Solar Electricity for 1 Year
Source: TRADE-OFFS: YOUR MONEY, YOUR CHOICES, National Priorities Project