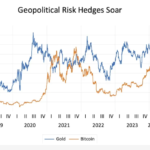
Gold is generally considered as an asset to hold against inflation. During periods of market volatility investors tend to flock to the yellow metal. Today gold for August delivery closed at $1,356 an ounce.
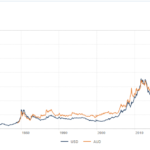
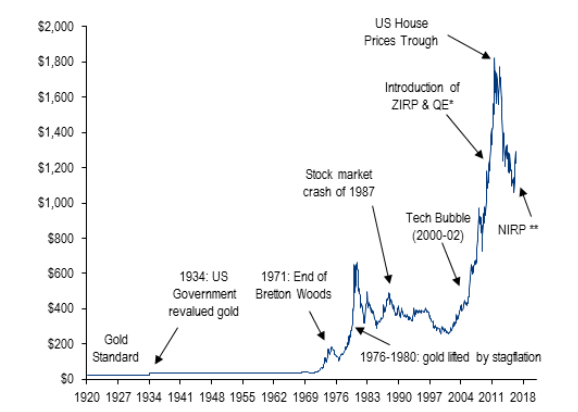
Over the course of many decades gold has seem dramatic rises and falls. The following chart shows the price of gold since 1920:
Click to enlarge
Source: Five risk/reward charts that long-term investors need to bookmark, FE Trustnet
From the article:
The price of gold was fixed at $20 per troy ounce under the Gold Standard Act until 1933, then Roosevelt revalued it at $35 in the midst of the Great Depression under the Gold Reserve Act of 1933. The Bretton Woods Agreement set a system of fixed exchange rates for major currencies in gold terms in 1994 but the US abandoned this in 1971.
Gold moved from $100 to more than $660 between 1976 and 1980 because of stagflation, with the yellow metal’s bull market brought to an end by anti-inflationary monetary policy in the 1980s. However, gold is now much higher than it was then.
“Intense deleveraging and zero interest rate policies across the G7 fuelled another bull market in gold, pushing prices from $600 per ounce to a peak of $1,900 per ounce in September 2011,” BofA ML said. “Recent declines in tail-risk fears and the prospect of the end of QE in the US caused gold to plunge to a six-year low of $1,051 per ounce by the end of 2015.”
Related ETF:
- SPDR Gold Shares ETF (GLD)
Disclosure: No Positions
Also see:
- Gold: It’s Still a Pet Rock, Jason Zweig, WSJ