A country’s economic growth as measured by GDP and stock market returns are not positively related to each other. Economic growth figures show what happened with the economy during a period and is a lagging indicator. On the other hand, stock returns are driven by a variety of factors including expectations of future earnings of a company. So in the short-term investors can over-hype certain stocks or sector leading to bubble level valuations. In this case, high stock returns does not have relationship with the underlying economy.
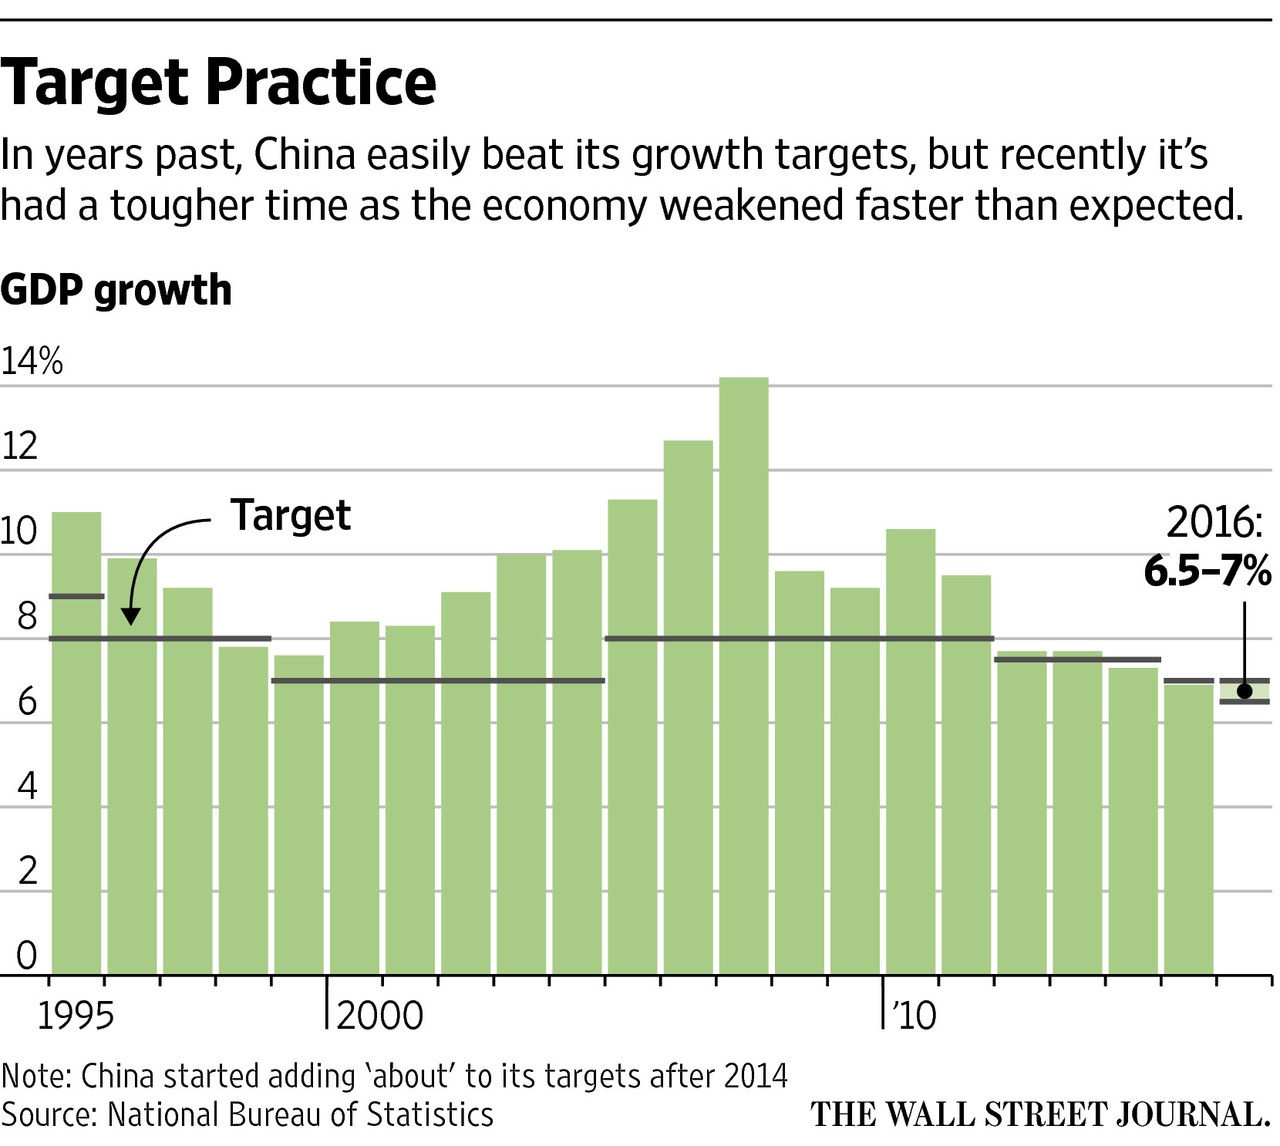
While the disconnect between economic growth and stock returns is high in developed countries, it gets to the extreme in developing countries. This is because emerging countries tend to have high economic growth and stock markets are still in early stages of development. For example, China is expected to grow only 6.5 to 7% this year. This figure is huge compared to developed countries. But for emerging countries like China high single digit GDP growth is considered moderate or low. Though Chinese GDP is projected to have this growth rate, stock markets in China are already down for the year. The Shanghai Composite Index has plunged 17% so far this year. It was down even more earlier in February.
Click to enlarge
Source: WSJ
Here is an excerpt from an article by Ken Fisher is founder and chief executive of Fisher Investments:
STOCKS MOVE FIRST
For example, the US economy did fine overall in 1981, growing 2.5 per cent, though a recession started mid-year. Stocks knew it was coming, falling 4.9 per cent for the year. GDP was positive, yet stocks fell!
That recession lasted until November 1982, and GDP shrank 1.9 per cent that year. But stocks started pricing in the coming recovery before the economy improved – gaining 21.6 per cent in 1982. Negative GDP, yet hugely positive stocks!
The same thing happened in 2000, when real US GDP grew 4.1 per cent but stocks peaked and started their first down-leg of a major bear market, signaling the 2001 recession. Similarly, GDP was actually positive in 2008, though flattish, growing 0.4 per cent for the year, while stocks fell a big 37 per cent.
In 2009, stocks turned up in March, but the economy didn’t turn positive until the third quarter. Though growing by year-end, US GDP shrank 2.4 per cent in 2009, while US stocks boomed 26.5 per cent.
The positive third-quarter GDP reading was first released at the end of October. If you waited for that, you missed a 31.5 per cent move in US stocks from the March low. Stocks move first – up or down.
Second problem: even during a growth cycle, stocks can be below average when growth is above average, and vice versa. In 1992, real GDP growth was above average – 3.4 per cent – but stocks returned a fairly lacklustre 7.6 per cent.
Why? Expectations can get out of whack. If growth is above average but below expectations, that can disappoint. If it’s better than expected while still below average, that can boost returns. Surprise moves the market in the intermediate term, for better or worse.
And never forget! Stocks look forward, while GDP measures what just happened and is released at a lag. So while economic growth is an overall market driver, don’t expect it to be a leading indicator.
The US is a huge developed nation. In smaller developed nations, you can get even more disconnect – and more still in emerging markets. China, for instance, has had huge growth in recent years – topping 14.2 per cent in 2007!
And China has had some huge market years, up 87.6 per cent in 2003 and 82.9 per cent in 2006, for instance. But Chinese GDP grew 9.6 per cent in 2008 – when stocks plummeted 50.8 per cent. And Chinese stocks fell huge in 2000, 2001, and 2002, when its economy boomed.
GROWTH IN CHINA
It’s normal for emerging nations to have huge GDP growth. As a nation grows, it has big per capita GDP gains. As more of its citizens move up into an emerging middle class, they start purchasing cars, appliances and luxury goods, which also fuels growth. That in turn requires more infrastructure, which results in greater wealth and more growth.
Chinese GDP and stock market returns Year China real annual GDP (%) MSCI China returns (%) 2000 8.4 -30.5 2001 8.3 -24.7 2002 9.1 -14 2003 10 87.6 2004 10.1 1.9 2005 11.3 19.8 2006 12.7 82.9 2007 14.2 66.2 2008 9.6 -50.8 2009 9.2 62.6 2010 10.6 4.8 2011 9.5 -18.2 2012 7.7 23.1 2013 7.7 4 2014 7.3 8.3 Source: International Monetary Fund, World Economic Outlook Database, Factset, MSCI China total return in US dollars Plus, though China remains officially ‘communist’, it has loosened its economy tremendously (relatively). A lot of that growth is years of suppressed ingenuity and productivity hitting its economy all at once. Can it continue? Sure. There’s no inherent reason (other than government meddling) why China has to slow down.
Source: GDP makes stocks grow: Fisher’s financial mythbusters, Ken Fisher, Money Observer
The key takeaway here for investors is that investors should not base on their investment decision in emerging markets based on economic growth alone.


