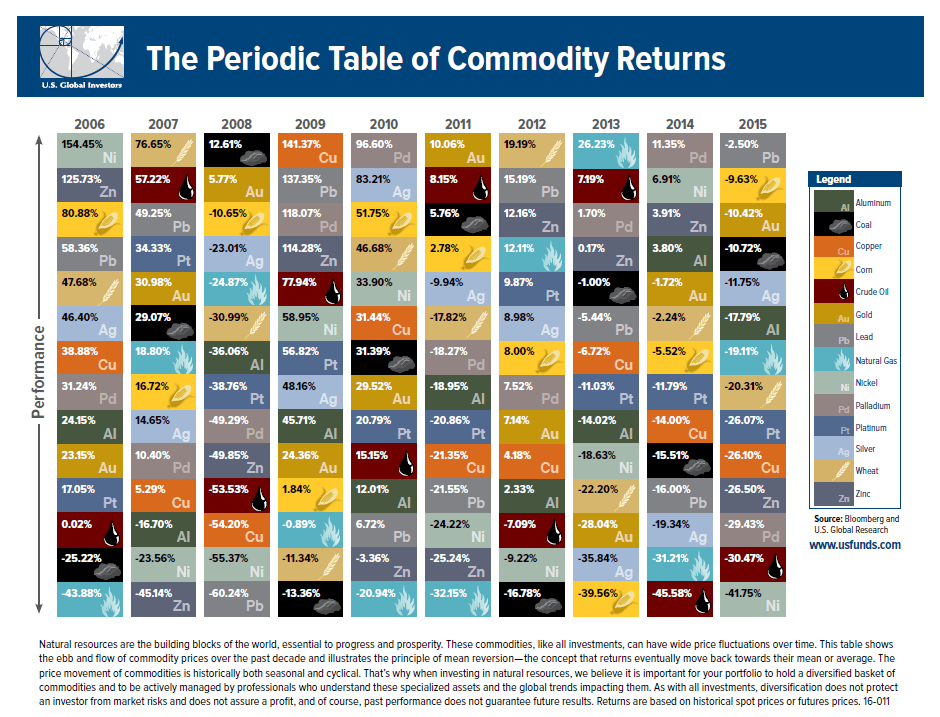
Similar to the Callan Table for equities, the Periodic Table of Commodity Returns is also a valuable tool for analysis and review of performance of a variety of commodities.
The Periodic Table of Commodity Returns For 2015 is shown below. With the major decline in crude oil and other commodities this chart is especially interesting to review.
Click to enlarge
Source: US Funds
The worst performing commodity last year was Nickel followed by Crude Oil which plunged over 30%. Gold fell just over 10% relative to oil.
Download: The Periodic Table of Commodity Returns For 2015 (in pdf)
Also checkout: The Collapse of Commodities in One Simple Chart (Visual Capitalist, Nov 2015)