UPDATE: The Callan Periodic Table of Investment Returns 2016: A Review ***(New)
Callan Associates recently published their famous Periodic Table of Investment Returns for 2015. This chart shows the importance of diversification.
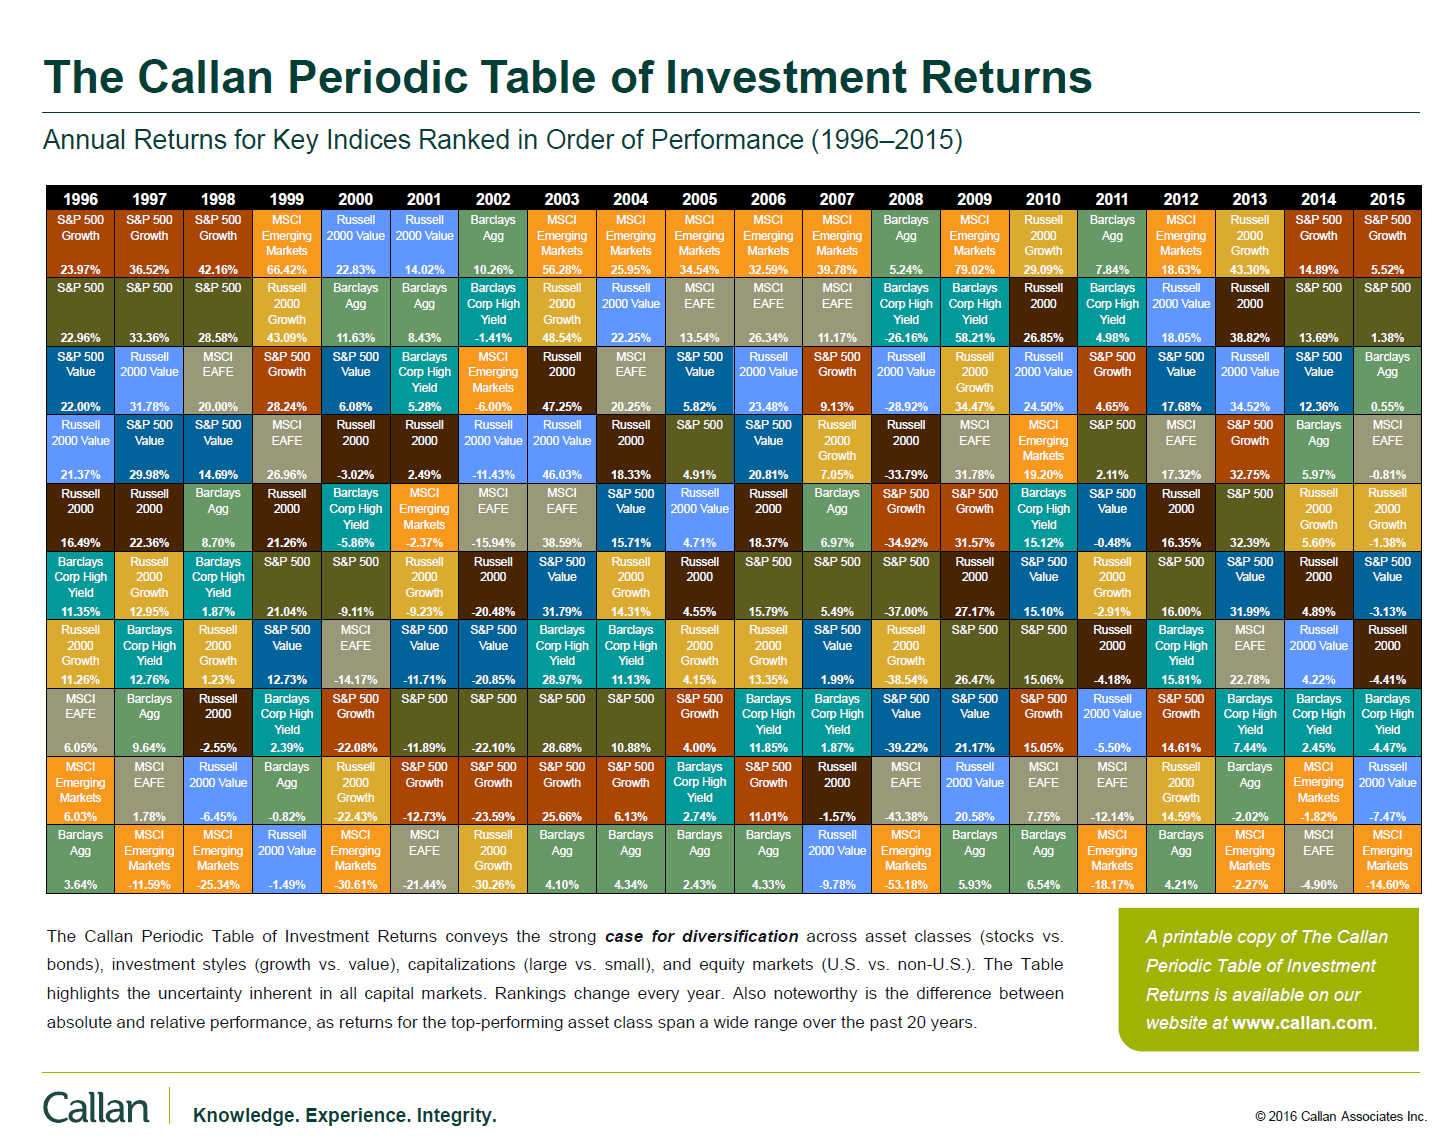
The Callan Periodic Table of Investment Returns for 2015 is shown below:
Click to enlarge
Source: Callan Associates
For example, the S&P 500 total return last year was 1.38%. On a price return basis it was actually negative at -0.73%. When dividends are included the negative returns turns positive. This is an important point to remember since most media outlets report the price return and not the total return.
Emerging markets has another disastrous year with the MSCI Emerging Markets Index losing over 14%. For the third year in a row, emerging stocks have had negative returns.
Download: The Callan Periodic Table of Investment Returns 2015 (in pdf)
Related ETFs:
- iShares Dow Jones Select Dividend ETF (DVY)
- SPDR S&P Dividend ETF (SDY)
- Vanguard Dividend Appreciation ETF (VIG)
- SPDR S&P 400 Mid Cap Growth ETF (MDYG)
- iShares Russell Midcap Index Fund (IWR)
- iShares MSCI Emerging Markets Indx (EEM)
- SPDR S&P 500 ETF (SPY)
- SPDR STOXX Europe 50 ETF (FEU)
Disclosure: No Positions
Related: The Callan Periodic Table of Investment Returns 2016: A Review

thanks for the report.
do you have info comparing another markets with and w/o dividends ?
Thanks for the comment. Unfortunately I do not have that info. But its a good idea for a future article. 🙂