The Brazilian economy and equity markets have been on a downward trend for the past few years. The benchmark Bovepa index is down 9.5% year-to-date. Ever since the Global Financial Crisis of 2008-09 Brazilian stocks continue to be poor performers. This is in sharp contrast to views held until a few years ago when the country was the top destination for global investors. However more and more it is becoming clear that the saying “Brazil is country of the future and always will be” is becoming true.
One of the obscured structural flaws in the Brazilian growth story is labor productivity, according to The Boston Consulting Group.Labor productivity simply means how efficient labor is or the output of a worker. For instance, there is a huge difference between a single worker operating a bulldozer to dig a ditch compared to 100 workers using a spoon and bare hands to dig the ditch.
From an article in BCG Perspectives:
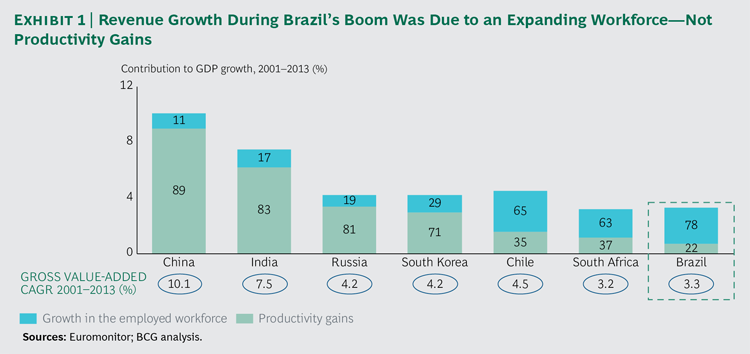
How the Boom Obscured Structural Flaws
The boom of the previous decade obscured structural flaws in the Brazilian growth story. In emerging markets such as China, India, and South Korea, rising productivity has been the chief driver of GDP growth. In the case of Brazil, however, productivity grew by a meager 1% a year on average from 2001 through 2013, well below the increase in wages over that period. (See Brazil: Confronting the Productivity Challenge, BCG report, January 2013.) Instead, 78% of the nation’s GDP growth from 2001 through 2013 was attributable to increases in the employed workforce. (See Exhibit 1.) These gains were driven by average annual growth in the working-age population of 1.8% and by falling unemployment, which reached a record low of 4.8% in 2014. But Brazil’s population is aging, and annual growth in the workforce through the rest of the decade is projected to drop to 1.4%.
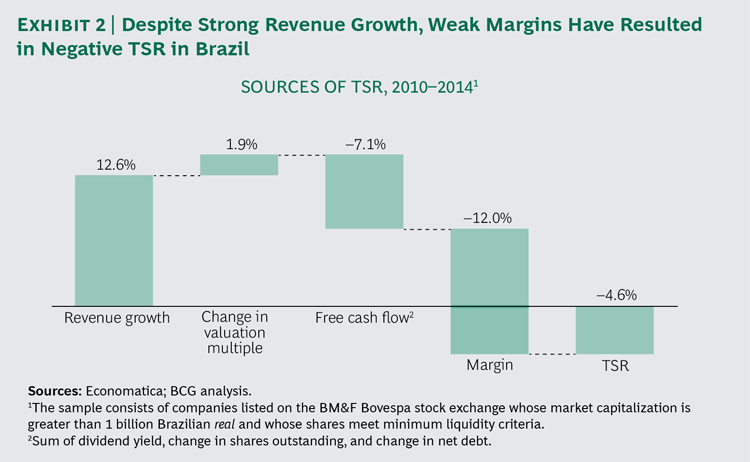
These factors translate into slower growth in most Brazilian industries. That is a considerable problem for many companies operating in Brazil and their shareholders. Our analysis shows that, on average, revenue growth contributed 12 percentage points of the total shareholder return (TSR) generated by companies on São Paulo’s BM&F Bovespa stock exchange from 2010 through 2014. (For an explanation of TSR, see “The Components of TSR.”)
During the same period, margins deteriorated significantly—offsetting the gains in TSR that derived from revenue growth. This was mainly the result of higher labor costs, excess capacity in several industries, and an overall loss of competitiveness. To finance revenue growth, moreover, companies diluted shareholder value. These were the main reasons for the average negative 4.6% TSR observed from 2010 through 2014. (See Exhibit 2.)
Source: Creating Value in Brazil’s No-Growth Environment, BCG Perspectives
The full article is worth a read.
Brazil still has a long way to go in bring infrastructure to world’s standards. For example, the distance from Sao Paulo International Airport to the downtown is 25-20 Kms. It takes between 1-2 hours by taxi to reach downtown depending on traffic. There is no public transportation like an express train or a regular train to the downtown from the airport. Clearly too much productivity is wasted due to lack of efficient transportation systems.
Related ETF:
- iShares MSCI Brazil Capped ETF (EWZ)
Disclosure: No Positions


Very good website, David. How do you know so deep about Brazil and its economy?
Thanks Miguel.Glad you like my site.
I learn a lot and do research as much as I can.Primarily I keep up by reading the Wall Street Journal, BusinessWeek and many online sites.