Equity investors have to ignore average returns reported for a short period of time like 3 years, 5 years, etc. This is because stocks are a very volatile asset class and and go up sharply as well as plunge dramatically from one year to the next. So simply taking an average over a very short-term like 3 years does not make sense for an investor. Basically when funds such as ETFs, mutual funds report a 3 year or 5 year average return it is simply useless information that investors should ignore. Instead it is better to look at the performance of a fund over the long-term such as 10 years or more. For example, in 2008 the S&P 500 declined by 38% excluding dividends. But in 2009 and 2010 it rose by 23% and 12% respectively. So taking average of these three returns to predict the average annual return an investor can expect from investing in an S&P 500 fund is wrong to say the least. This also shows how the S&P’s returns can be volatile from year over year.
Let us review this concept using the South Africa FTSE/JSE All Share Index returns from an research report by Mark Cliff at PSG Asset Management .
A closer look at historical returnsChart 1 below shows the rolling 12-month total returns of the FTSE/JSE All Share Index (with dividends re-invested) between 1 June 1996 and 30 September 2015. Each dark dot on the graph represents a return for the index for the preceding year. The blue line shows what inflation was for the corresponding period and the red line shows the average annualised return over the period. The dotted lines are one standard deviation above and below the average.Click to enlarge
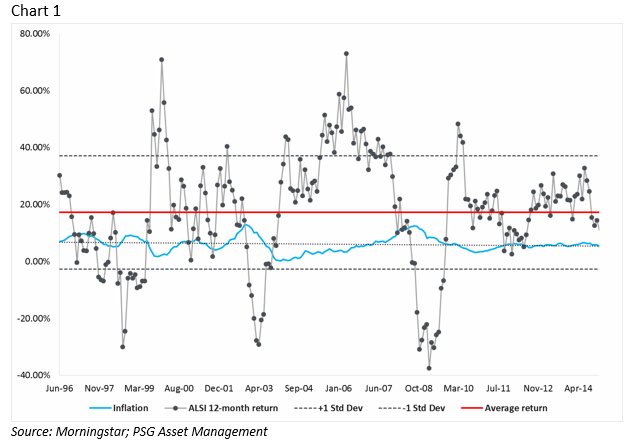
Calculations for the above chart show that the average 12-month return for the index was 17.24%. during the period shown. And the annualized standard deviation (variability) of these returns was 19.9%.
The author Mark noted the following observation:
So what we can see from this data is that while the average annual return was 17.24%, this occurred very infrequently. The reason for this is that the stocks which have made up this index over this period have been very volatile – as evidenced by a high standard deviation of nearly 20%.
When it comes to the more volatile asset classes – like equities – the variability of returns can be significant. The higher the volatility, the lower the probability that short-term returns will be near to average returns.