Gold is an important asset class to own by most investors. It does not produce a steady stream of regular income such as dividends and the only gain one can expect is due to price appreciation. So it is a great asset for investors seeking income. However gold has its advantages. For example, during times of global market chaos, recessions, etc. gold can offer some stability to a well-diversified portfolio as investors flee risky assets for the safety of treasuries and gold. Generally investors can allocate a small portion of their total assets to growth. How much one should allocate depends on age and other individual factors.
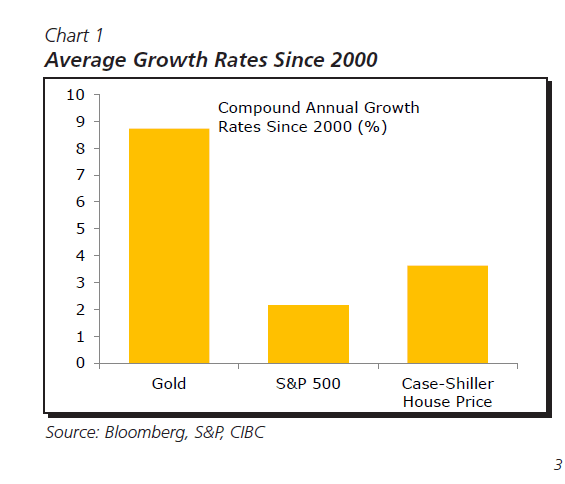
a) Gold great to hold during the global financial crisis of 2008-09 and the dot com bubble as the chart shows below. From 2000 to August this year, Gold has produced an average annual growth of 9% compared to about 2% for the S&P 500:
Click to enlarge
Source: Gold: Glittering no more, CIBC World Markets
From the CIBC report:
However, as a store of value since the turn of the millennium, gold is still performing better than others. An investment in gold made in 2000 has enjoyed a 9% compound growth rate. Of course, if that investment was cashed in in 2011, when gold prices peaked, the annual growth rate would have been much higher. But that 9% is still much healthier than the gains made by investments in the S&P 500 Index, or in the US housing market at that same time (Chart 1)
b) Despite huge run-up during the financial crisis, gold has never reached its inflation adjusted peak reached in 1980.
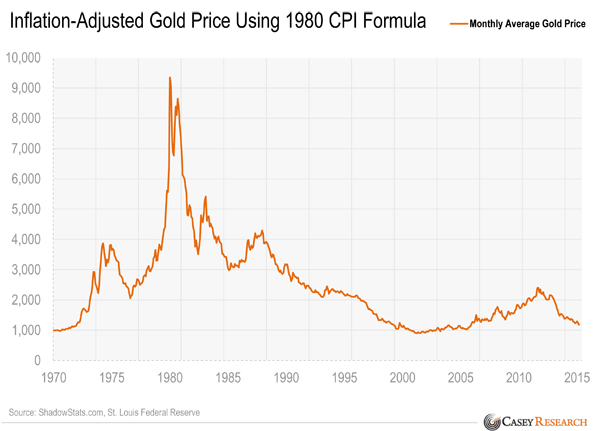
Note: Chart data above is as of April 2015.
Source: Gold Is Near an All-Time Inflation-Adjusted Low, Casey Research
Here is another excerpt from a recent article on WSJ:
To understand the stock market, check out the gold market. The two tell a lot about each other.
People buy gold when they are afraid of the future. They buy stocks at the opposite time, when they are hopeful. Today, despite worries about China, Greece, a likely Federal Reserve interest-rate increase and an uncertain corporate-earnings outlook, the gold market is giving a clear signal: Investors, on the whole, aren’t very frightened.
The last time gold hit a record, after controlling for inflation, was 1980. It has never been back in inflation-adjusted terms and, at Friday’s close, was 57% below its 1980 peak. The Dow Jones Industrial Average, also adjusted for inflation, last hit a record on May 19. At Friday’s close it was 3.7% off that level.
Investors are nervous enough that they aren’t pushing stocks to new records, but not nervous enough to sell heavily or buy gold.
“We view gold as an Armageddon-scenario asset,” explained Jim McDonald, chief investment strategist at Northern Trust Corp., which oversees $946 billion in Chicago. Such a scenario isn’t among his concerns today.
For reference, New York gold futures peaked at $825.50 a troy ounce on Jan. 21, 1980, which in today’s dollars is about $2,532.08.
Source: Investors Are Far From Sold on Gold, The Wall Street Journal
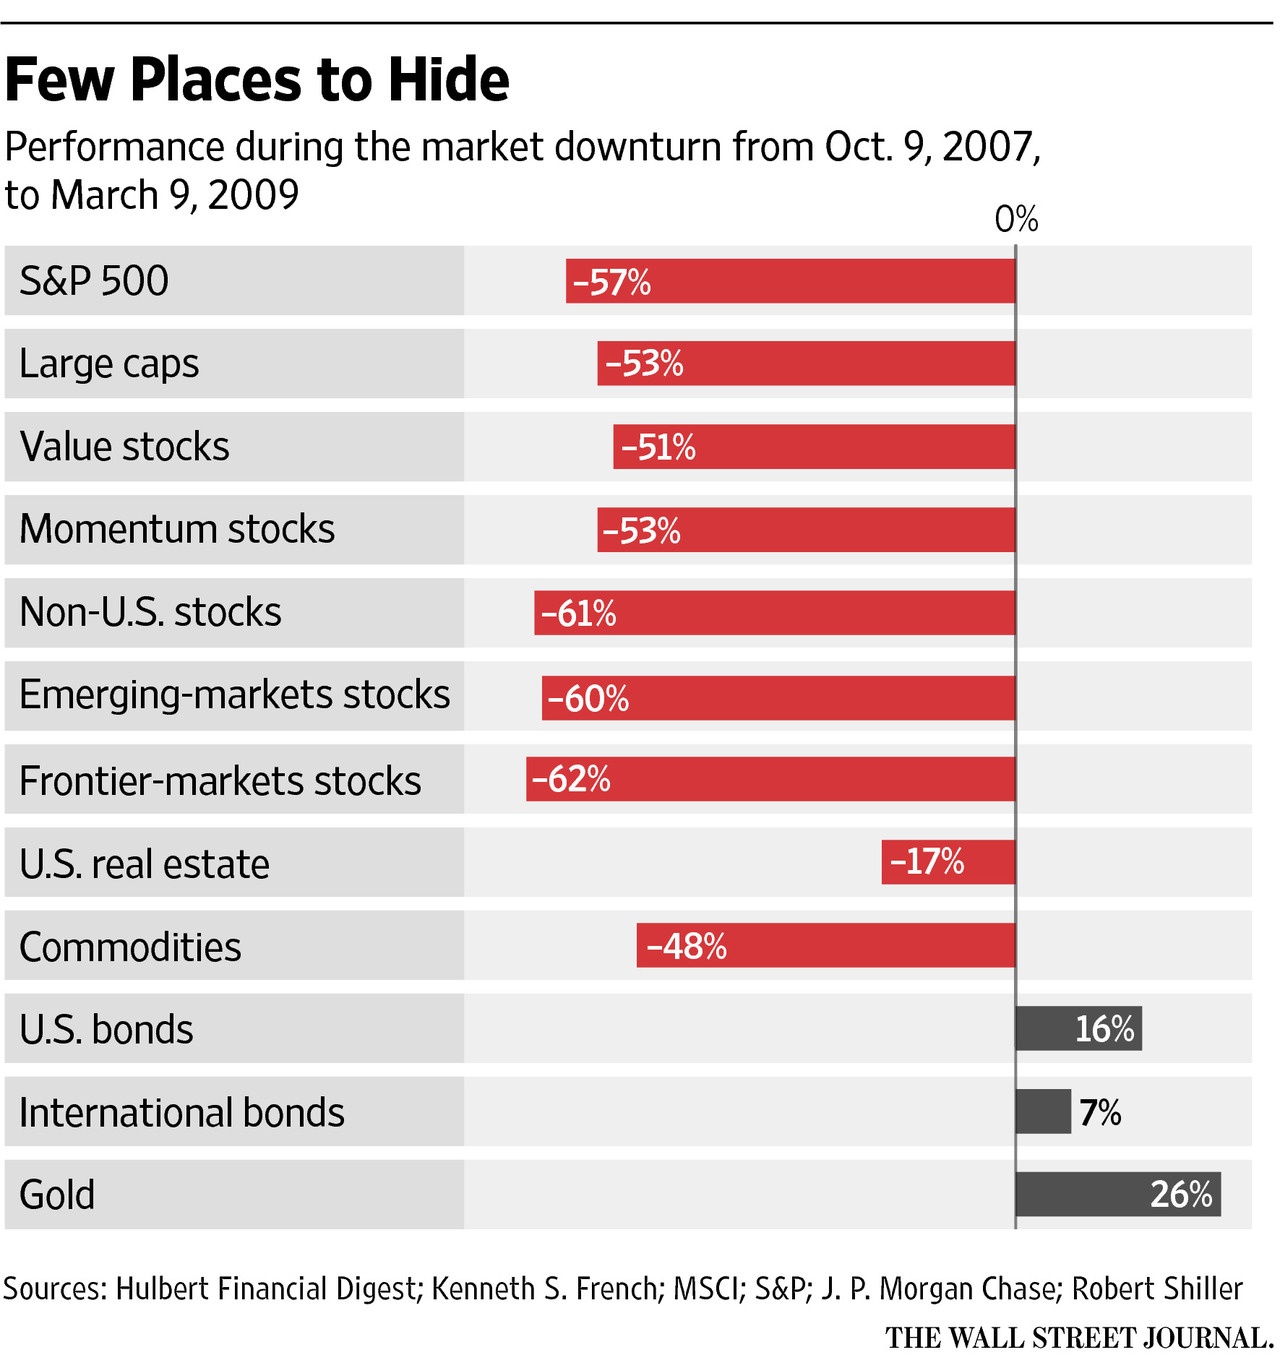
c) The following chart shows gold shot up during the global financial crisis and was one of the few places to hide.

Source: If the Bear’s Near, Which Assets Protect You, WSJ