While researching on periodic table of investment returns, I came across the following chart which can be very useful for Canadian investors. This chart shows the comparison of returns for various asset classes. Canadians can use this to plan their portfolio allocation strategies.
Click to enlarge
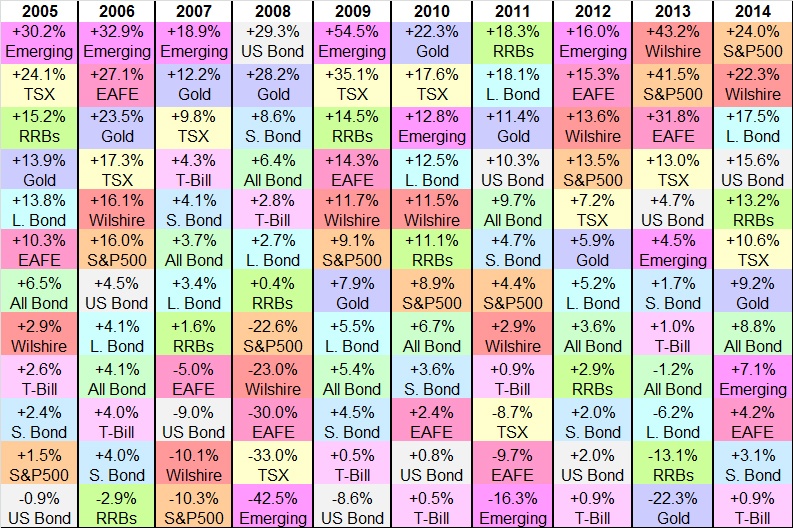
Legend:
| Text | Represents |
|---|---|
| RRB | Real return bonds |
| S&P500 | S&P 500® – S&P Dow Jones Indices |
| L. Bond | Canada Long Term Bond Index – FTSE TMX Canada Indices |
| S. Bond | Canada Short Term Bond Index – FTSE TMX Canada Indices |
| TSX | S&P/TSX Composite (CAD) – S&P Dow Jones Indices |
| Wilshire | Wilshire 5000 Total Market Index – Wilshire Associates |
| All Bond | Canada Universe Bond Index – FTSE TMX Canada Indices |
| US Bond | Barclays US Aggregate Bond Index |
| Gold | Gold bullion |
| Emerging | MSCI Emerging Markets Indexes – Emerging Markets – MSCI |
| EAFE | MSCI EAFE Index – Developed Markets – MSCI |
| T-Bill | 3 month Treasury Bills (T-Bill) |
Source: Finiki
Here is one way to interpret this chart. In 2014, the S&P 500 shot up by 24% in Canadian dollar terms. But the TSX Composite index was up only 10.6%.Similarly the TSX lagged the S&P 500 in 2011, 2012 and 2013 as well.
Related ETF:
- iShares MSCI Canada (EWC)
Disclosure: No Positions