In 2010 I wrote an article on the continued decline in holding periods of stocks globally. In that article I included the following chart that shows the average holding period for a given stock on the NYSE:
Click to enlarge
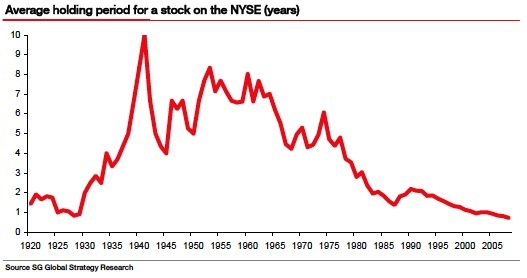
Source: Stock Holding Periods Growing Shorter
On this week’s The Intelligent Investor column, Jason Zweig penned an excellent piece on a related topic. According to the article, the annual turnover rate of U.S. stocks is 307% so far this year. This implies an average holding period of just 17 weeks.
Have investors finally started to get their hyperactivity under control?
According to the New York Stock Exchange, annualized turnover—the rate at which stocks are bought and sold—is down to 63% from a high of 110% in 2010. With a 100% annual turnover rate equal to a holding period of one year, a 63% rate implies that investors are holding the average NYSE stock for 19 months at a time, up from an average of 11 months five years ago. Meanwhile, the investment-research firm Morningstar calculates that portfolio turnover at U.S. stock mutual funds is down to 66% from 75% in 2010.
But these numbers don’t tell the full story. Far from growing more patient, investors appear to be getting twitchier. And now more than ever, trying to outrace Wall Street at its game of trading ever faster is folly.
Consider the NYSE turnover figures, which cover only those stocks listed and traded there. Many of the same stocks are also traded elsewhere; about three-quarters of their total volume occurs on other exchanges and trading platforms.
Including trades on all marketplaces, the annual turnover rate in U.S. stocks is running at 307% so far this year, up from 303% in 2014, reckons Ana Avramovic, a director of trading strategy at Credit Suisse in New York. That is down from the peak turnover rate of 481% in 2009, but it amounts to an average holding period of only 17 weeks.
And that figure doesn’t include exchange-traded funds, which get flung around like hot potatoes. According to John Bogle, founder of the Vanguard Group, the 20 largest ETFs were traded last year at an average turnover rate of 1,244%. That includes activity by individual and institutional investors as well as high-frequency traders who rapidly buy and sell by computer. A 1,244% turnover rate implies a holding period of 29 days.
Source: Why Hair-Trigger Traders Lose the Race by Jason Zweig, The Wall Street Journal, April 10, 2015
Individual investors have an edge over Wall Street when it comes to investing in stocks. Unlike mutual funds, hedge funds, etc. retail investors need not continuously churn their holdings frequently. They can build a portfolio of high-quality stocks or invest in an index fund and sit on it for years. Fund companies have to do churning on a frequent basis because of many reasons. For example, they may have some agreement with brokerages that they would send so many trades per month or per quarter. Another reason is the peer pressure of fund managers. We can imagine most fund managers like sheep. Most just follow the herd. So when other managers or selling or buying stocks they are also forced to do the same thing.
The key point to remember is while hedge fund and mutual fund managers have to trade to make a living using opium OPM (Other People’s Money) individual investors do not have to fall for this temptation since they are managing their own hard-earned money. So even though it is easier to trade due to the advancement in technology most investors are better-off being a tortoise and achieve their long-term goals.
Related: Duration of Stock Holding Periods Continue to Fall Globally, TFS