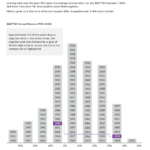
I posted the Periodic Table of Investment Returns for Commodities for 2015 last month. Here is the chart for Emerging Markets from 2005 to 2014:
Click to enlarge
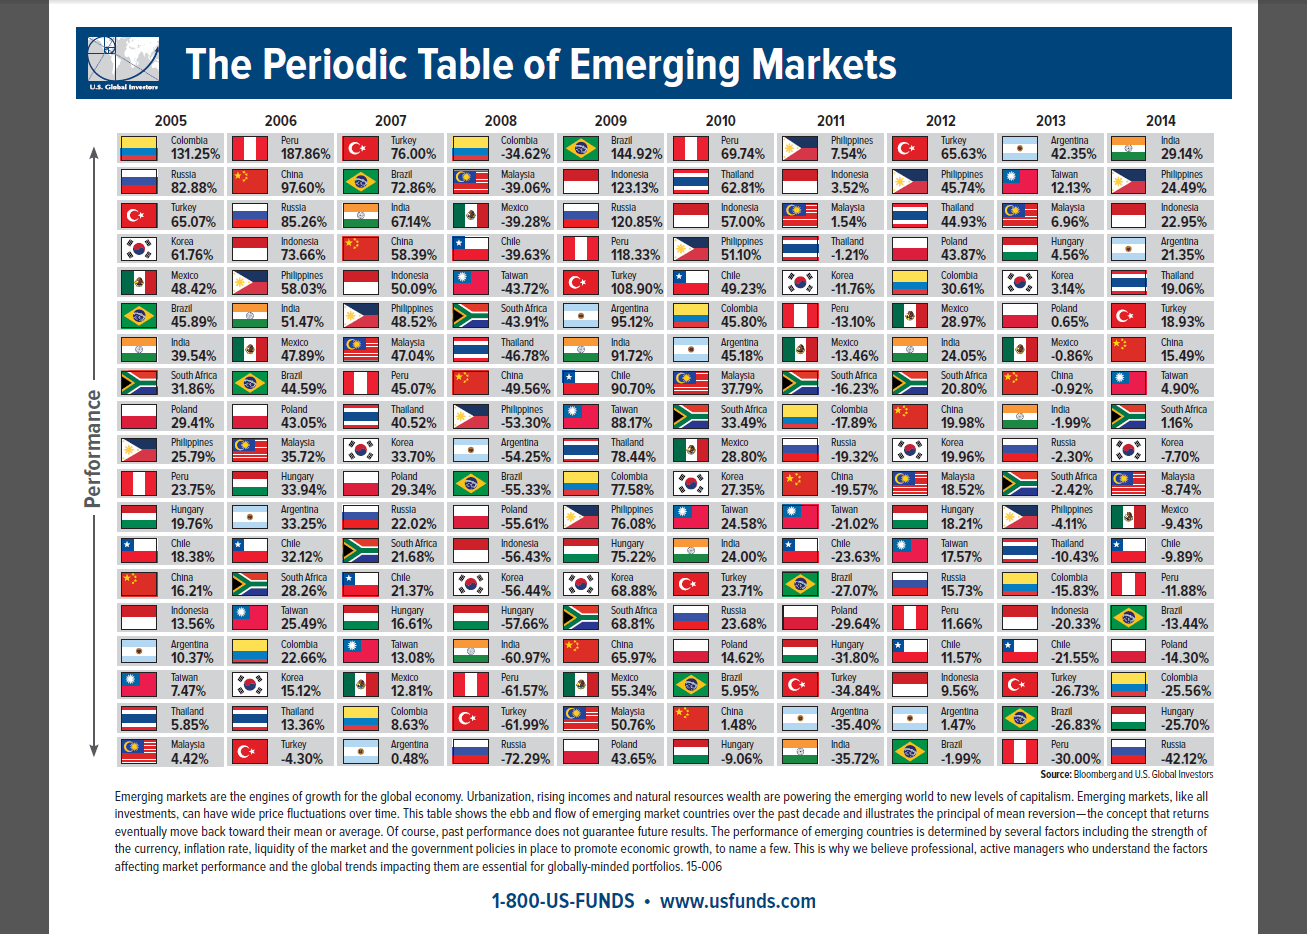
Source: US Funds
A few observations:
- The best performing emerging market last year was India with a return of over 29%. This year India’s Sensex is up a decent 5.51% year-to-date.
- Russia was the worst performer with a loss of over 42%. With Ukraine crisis still ongoing and the Russian economy adversely impacted from lower oil prices its best to avoid Russian stocks this year.
- Global investors’ attraction towards Brazil has disappeared in the past few years. In 2009, Brazil returned about 145%. Since then it has declined every year except in 2010 when it returned a mere 5%. With Petrobras (PBR) mired in corruption investigations and oil prices remaining low, investors may want to be very cautious of Brazilian stocks this year.
Also checkout: The Periodic Table of Emerging Markets 2004 To 2013
Disclosure: Long PBR