“The way to crush the bourgeoisie is to grind them between the millstones of taxation and inflation.”
– Vladimir Lenin
The S&P 500 closed at 1,977 yesterday. The index has more than doubled from the lows reached in March 2009 at the peak of the global financial crisis. For the first time it crossed the 2,000 mark in August and earlier this month reached a new record of 2,019. According to an article in UK-based MoneyWeek magazine S&P 500 has hit over 30 new record highs this year.
These records may seem fantastic at face value. However when inflation is taken into consideration and the S&P 500’s returns are reviewed in terms of real returns, the soaring index values does not mean much. In fact, quoting Gene Epstein of Barron’s the article notes that the S&P 500 is actually 5% below the previous inflation-adjusted, all-time high reached in March 2000.
Click to enlarge
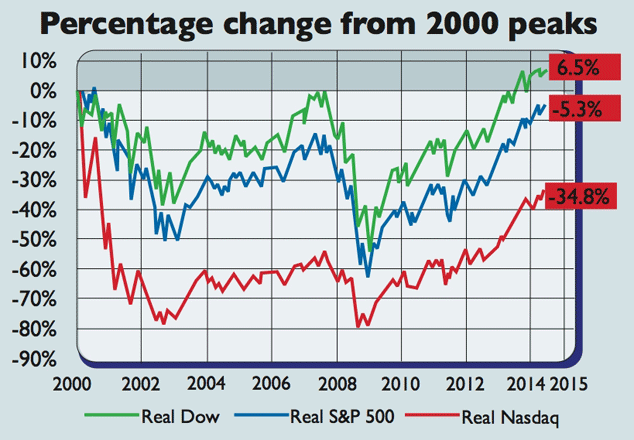
Source: Chart of the week: Rain falls on the bulls’ parade, MoneyWeek, 9/26/14
From the article:
The S&P 500 previously hit an inflation-adjusted, all-time high in March 2000. Since then, US inflation, as measured by the Consumer Price Index (CPI), has climbed by almost 40%. Factoring that in transforms the previous record to 2,124, notes Epstein, and the market is still more than 5% below this milestone.
Meanwhile, the technology-heavy Nasdaq Composite has done far worse in real terms since 2000; investors in the Dow Jones index, on the other hand, have managed to make a small profit.
So for example an investor holding equities in the form an index fund mirroring the S&P 500 from March 2000 has had a negative return when inflation is included. However in general most investors do not pay much attention to analyze their returns accounting for adverse effects of inflation. The above chart brutally makes it clear that despite being the market for 15 years the investor did not even make a positive real return.
According to one estimate, the value of the US dollar has fallen by 38.1% since 2000. Hence an item that cost $100 in 2000 would cost $138.13 today. To put it another way, the government has destroyed the purchasing power of the dollar by an astonishing 38% during this short-term time period. Over decades the dollar has lost most its value. The following chart shows the decline in purchasing power of the dollar from 1900 thru 2010:
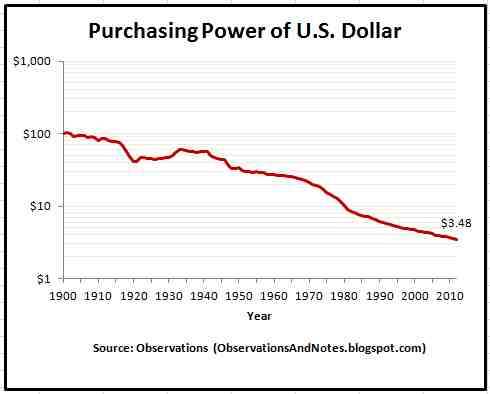
Source: The Decrease in Purchasing Power of the U.S. Dollar Since 1900, April 21, 2011, Observations Blog
Related ETFs:
- SPDR S&P 500 ETF (SPY)
- SPDR Gold Trust ETF (GLD)
- PowerShares QQQ Trust (QQQQ)
- SPDR Dow Jones Industrial Average ETF (DIA)
Disclosure: No Positions