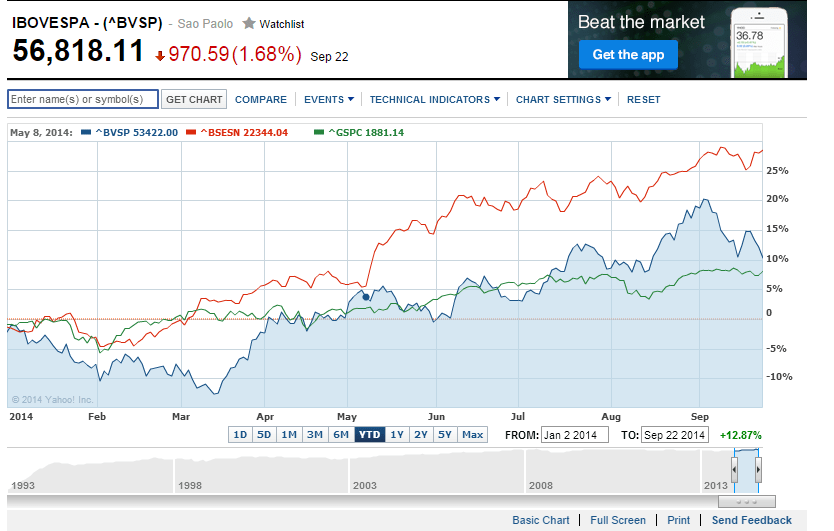
Brail’z Bovespa is up 10.3% year-to-date while India’s Sensex is up 28.5%. The S&P 500 is up by 7.90% YTD.
Click to enlarge
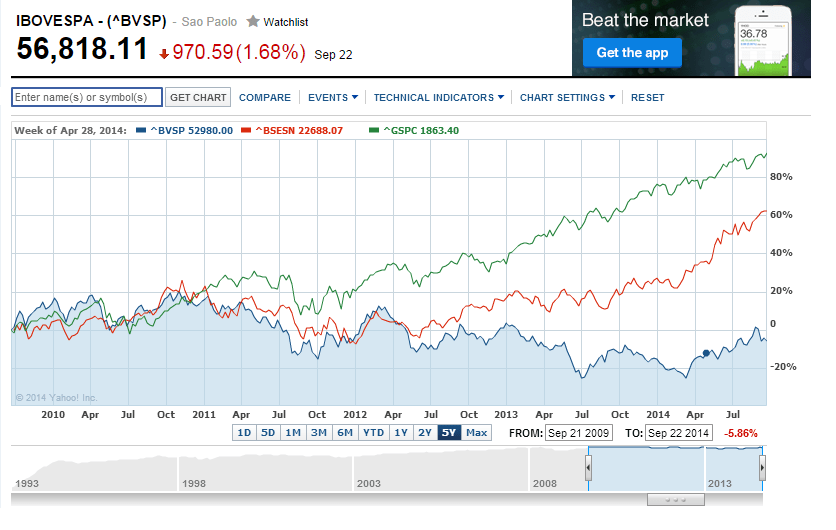
On a 5-year basis the S&P 500(in Green) has outperformed both Brazil and India as shown in the chart below. Brazil(in Blue) has lagged India by a significant margin over the past five years.
Source: Yahoo Finance
Related ETFs:
Disclosure: No Positions
