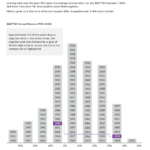
The Callan Periodic Table of Investment Returns shows the annual returns for 20 years for many categories.It is a valuable tool to show the importance of diversification among asset classes. Similar to the Callan Table the following periodic table shows the annual returns for many single country emerging markets from 2004 thru 2013:
Click to enlarge
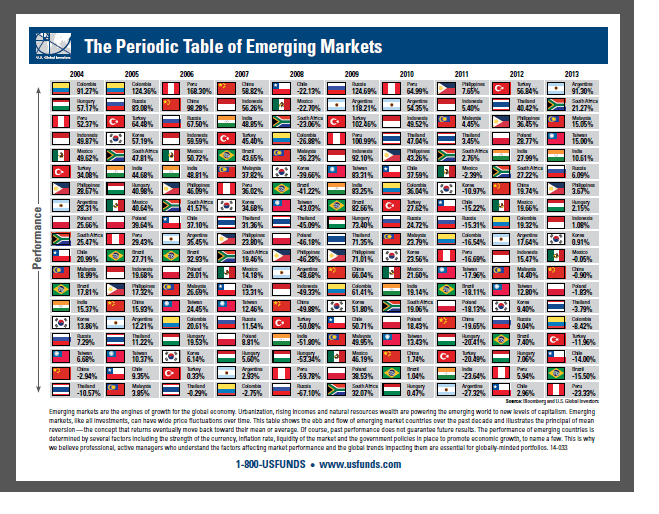
Source: US Funds
Some observations from the above table:
- Last year some of the traditional favorite emerging markets such as Brazil and Chile were the worst performers while Argentina was the top performer followed by South Africa. Note: The returns noted are the benchmark returns for the country. Brazil’s Bovespa was down 15.5% in 2013.
- After peaking in 2009, Brazil has disappointed investors every year since with poor to average returns.
- Mexican stocks has generally yielded good returns in each of the years shown.Even during the depth of the global financial crisis in 2008. Mexico was down only over 22% compared to worse returns for other emerging markets.
- The performance Russian equity market is closely tied to the price of crude oil. As oil prices soared in 2009, Russian stocks generated a 125% return. However in 2013 as oil prices stabilized Russia yielded an average return of over 6%.
- Other than Colombia and Peru, no country has been the best performer two years in a row for the period shown. This is why diversification between countries is important. In the past five years the best performing country was different each year.
- The worst performing country in one year can become the best performing country the next year. In 2008, Russian stock collapsed with a loss of over 67%. But the following year they soared by around 125%. Hence this shows the extreme volatility of emerging markets and the need for diversification among countries.
- Emerging markets can go from global investors’ top destination to just another emerging market quickly. For example, Chinese stocks ranked the best among emerging markets in 2007 but fell hard the following year in line with other BRIC countries like India and Russia. While in 2007 Chinese equities returned 66% since then their annual performance has been poor.The main reason for this dismal performance is that the Chinese economic growth slowed and investors’ appetite for Chinese stocks has decreased gradually over the years.
Related ETFs:
- iShares MSCI Emerging Markets Index Fund (EEM)
- Vanguard Emerging Markets ETF (VWO)
- iShares MSCI Brazil Index Fund (EWZ)
- Market Vectors Russia ETF (RSX)
- iShares FTSE/Xinhua China 25 Index Fund (FXI)
- iShares S&P India Nifty 50 ETF (INDY)
For a better quality image you can download the pdf version of the above chart at the US Funds site.
Disclosure: No Positions