The MSCI Emerging Markets Index gives exposure to large and mid-cap companies in 21 emerging markets that include: Brazil, Chile, China, Colombia, Czech Republic, Egypt, Greece, Hungary, India, Indonesia, Korea, Malaysia, Mexico, Peru, Philippines, Poland, Russia, South Africa, Taiwan, Thailand and Turkey. At the end of 2013, the index had 824 constituents.
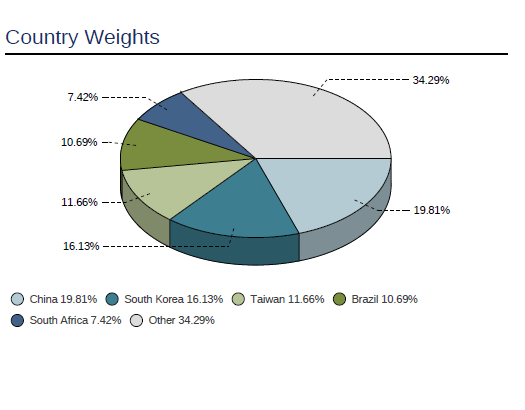
The chart below shows the country weights in the index:
Click to enlarge
China accounts for the largest allocation at nearly 20%. Chinese equities have not performed well in the past few years and generally there are plenty of risks investing in Chinese companies including lack of transparency, state-ownership, etc. Hence investing in an emerging market ETF such as the iShares MSCI Emerging Markets ETF (EEM) which has net assets of over $28.0 billion involves high exposure to China.
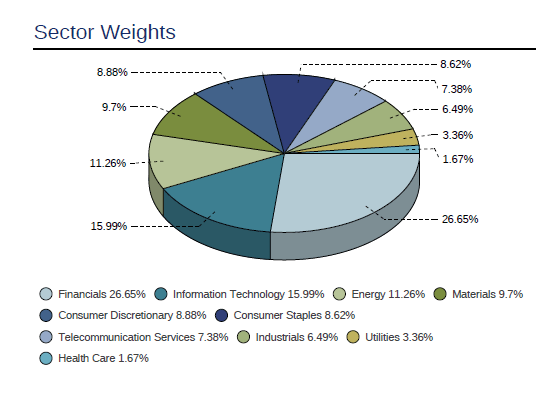
In terms of sector allocation, financials account for over one-fourth of the index followed by IT:
Source: MSCI
The dividend yield of the index at the end of last year was 2.60%. This yield is higher than the average yield of about 2% for the S&P 500.
The Top 10 Components in the index are: Samsung Electronics, Taiwan Semiconductor(TSM), Tencent Holdings (TCEHY), China Mobile(CHL), China Constructions, Gazprom (OGZPY), ICBC, Naspers, America Movil (AMX)and MTN Group (MTNOY)of South Africa.
Disclosure: No Positions
