The S&P 500 is up 26.72% YTD in terms of price returns and 29.22% based on total returns. Given the strong up this year, many investors are wondering if U.S. stocks are overvalued or fairly valued. With about a month to go this year, any further run to the upside will make the returns even more fantastic.
According to a report by Deutsche Bank Assest & Wealth Management last month, U.S. stocks are fairly valued from a historical perspective.
Click to enlarge
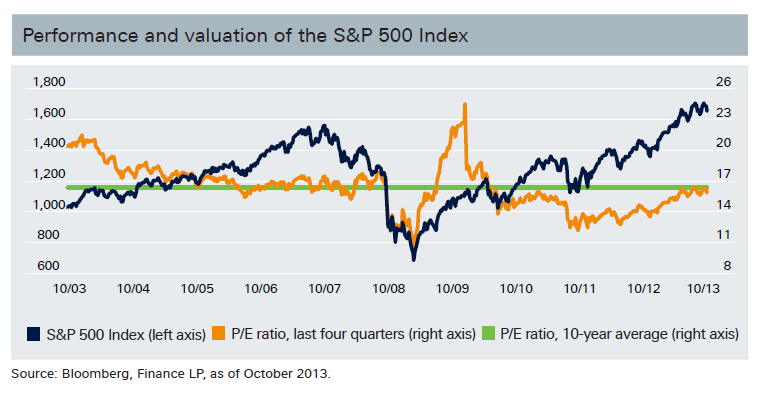
Source: CIO View, October 2013, Deutsche Bank Assest & Wealth Management
From the report:
The average price-to-earnings (P/E) ratio of the S&P 500 Index is 15.9 and approaching the 10-year average of 16.4. The S&P 500 Index could climb to around 1,800 points in the next 12 months, spurred on by continued profit growth, and we expect the profits of S&P 500 Index companies to increase by 7%. Including dividends, investors in U.S. blue chips could achieve a gain of around 10%.
All the sectors within the S&P 500 with the exception of Real Estate are up by double digits YTD. Hence investors may want to selectively initiate new positions at this time.
Related ETF:
SPDR S&P 500 ETF (SPY)
Disclosure: No Positions
Update:
From Nobelist’s Valuation Measure Draws Questions in The Wall Street Journal on Nov 21, 2013:
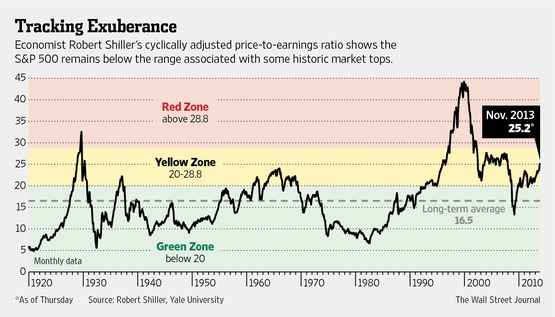
Bubble-hunting economist Robert Shiller‘s stock-market valuation measure is waving a yellow flag, but there is a debate brewing over whether even that is too alarming a picture.
Of 15 stock-market valuation measures tracked by Bank of America BAC +0.50% Merrill Lynch’s stock strategy team, Mr. Shiller’s cyclically adjusted price/earnings ratio is the only one above its long-term average.
The CAPE ratio, which aims to provide a long-term comparison point for stock valuations, uses the last 10 years’ worth of profits and controls for inflation.