The U.S. equity market is one of the best performing market among developed countries so far this year. For example, the S&P 500 is up by 14.35% on price return basis and 15.37% on total return basis year-to-date. Financials have skyrocketed with the sector in the index up by over 20%. Healthcare and Consumer Discretionary sectors also have had a great with a return of 20% or closer to that. Telecoms and Utilities, usually considered as income plays for their slow and steady growth with high dividend payouts, are lagging the overall performance of the market.
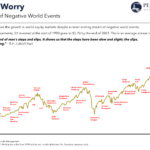
Financials were the hardest hit during the global financial crisis. Less than a few years later their strong performance is surprising. As the market sentiment has improved stocks are continuing to soar higher confounding skeptics by ignoring negative news and focusing more on positive news and company-specific events. As a result many investors are wondering if U.S. stocks are overvalued now after the double digit gains in less than six months.
According to a report by Peter Buchanan of CIBC World Markets, U.S. stocks are not yet overvalued at least based on one measure. He states that the the ratio of stock market capitalization to GDP is still lower relative to two earlier highs.
This ratio shows the percentage of GDP that represents stock market value. It can be used to identify if a market is overvalued or undervalued. Any figure over 100% is considered as U.S. market being overvalued and a figure of around 50% is said to show that the market is undervalued. It should be noted however that this metric does not always work perfectly. For example, in 2000 it stood at 153% implying that the market was overvalued. Later the markets crashed. But in 2003 it was at around 130% and instead of falling, stocks went to reach all-time highs. So this measure must be used with caution.
From the CIBC report:
Click to enlarge
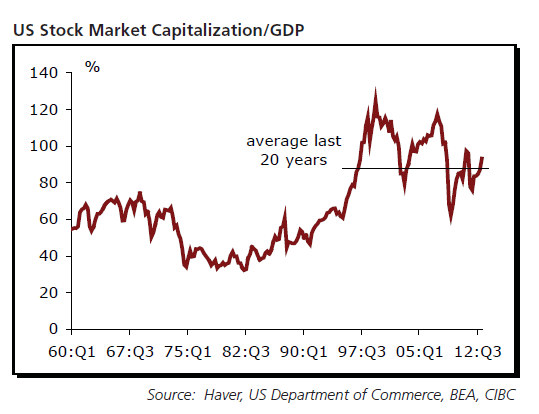
Beyond the raft of conventional metrics trotted out by analysts, like forward and Shiller trailing PEs, one interesting metric is the ratio of stock market capitalization to GDP. Publicly listed corporations play a greater role in the economy than they once did. Many listed corporations do more of their business overseas than in the past, and interest rates are also lower. While that complicates longer term comparisons, data for shorter intervals can still convey useful information. At 97%, that ratio today is still some ways from its highpoint of the last two cycles.
Source: Are Abenomics Benefits in Abeyance?, The Week Ahead, June 3-7, 2013, CIBC World Markets
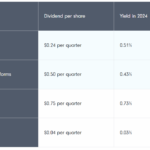
Investors willing to bet on further rise in U.S. stock prices can consider some of the companies listed below:
1.Company: Cullen/Frost Bankers Inc (CFR)
Current Dividend Yield: 3.11%
Sector: Banking
2.Company: T. Rowe Price Group Inc (TROW)
Current Dividend Yield: 2.00%
Sector:Capital Markets
3.Company:Consolidated Edison Inc (ED)
Current Dividend Yield: 4.31%
Sector:Multi-Utilities
4.Company:Airgas Inc (ARG)
Current Dividend Yield: 1.87%
Sector: Chemicals
5.Company:The Clorox Co (CLX)
Current Dividend Yield: 3.42%
Sector:Household Products
6.Company:PPG Industries Inc (PPG)
Current Dividend Yield: 1.59%
Sector: Chemicals
7.Company: Kellogg Co (K)
Current Dividend Yield: 2.84%
Sector:Food Products
8.Company: Quest Diagnostics Inc (DGX)
Current Dividend Yield: 1.94%
Sector:Health Care Providers & Services
9.Company:Ametek Inc (AME)
Current Dividend Yield: 0.56%
Sector:Electrical Equipment
10.Company: Church & Dwight Co Inc (CHD)
Current Dividend Yield: 1.84%
Sector:Household Products
Note: Dividend yields noted are as of May 31, 2013. Data is known to be accurate from sources used.Please use your own due diligence before making any investment decisions.
Disclosure: No Positions