The S&P 500 Index fell by 37% in 2008 when the financial crisis hit the global equity markets. The index has yielded positive returns since with 26.46% in 2009, 15.06% in 2010 and 2.05% last year. The S&P 500 has shot up by 14.6 % so far this year.
In the years since the crisis, the real economy has not shown any significant improvement. For example, unemployment continues to be a major problem with about 12.5 million unemployed in August and the official unemployment rate remains stubborn at over 8%. On the positive side of the equation, the number of bank failures declined to 92 in 2011 from 157 in 2010. This year only 43 banks failed year-to-date. The housing market has stabilized but will take years to reach pre-crisis levels. So the strong performance of the U.S. equity markets can be attributed mainly to liquidity due to the quantitative easing programs (QE1, QE2 and QE3) implemented by the Fed. Liquidity-driven markets tend to be highly volatile and can go high only as long as ample liquidity remains.
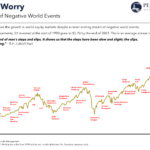
The following chart neatly illustrates the current state of equity markets:
Click to enlarge

Source: Heads I win, Tails You Lose, by Avery Shenfeld, Chief Economist & Managing Director, CIBC World Markets