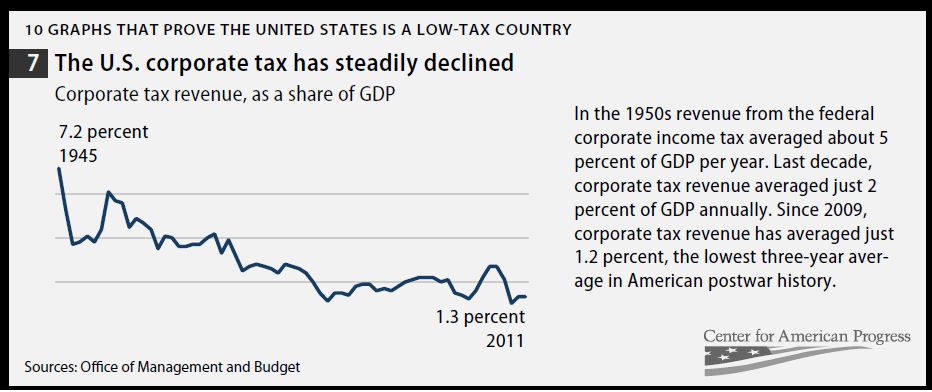
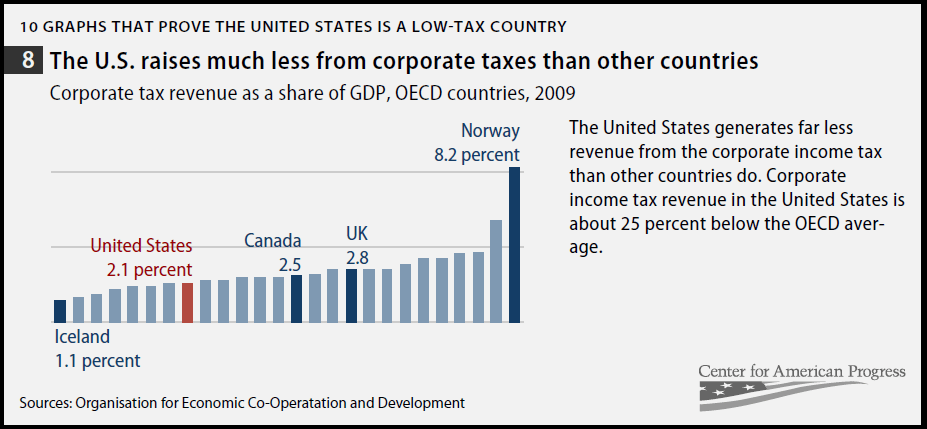
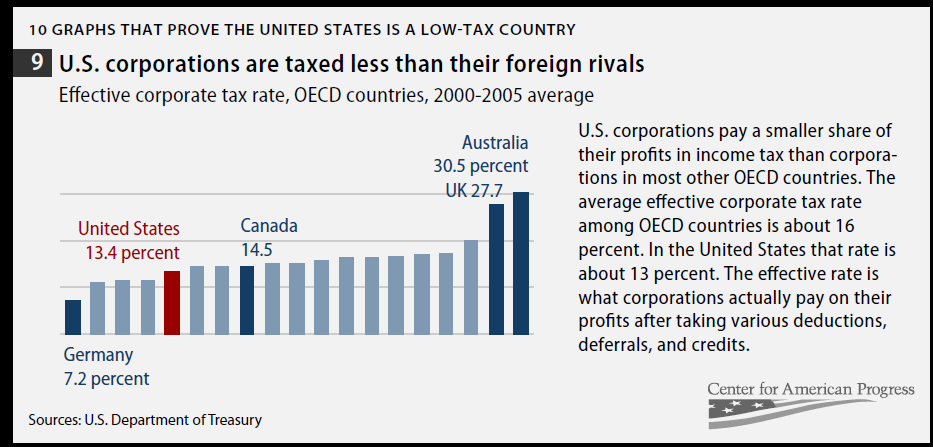
In an earlier article I discussed about the total tax revenues as a percentage of GDP.In this post lets a look at three charts about corporate taxes in the U.S.
Chart 1:
Chart 2:
Chart 3:
Source: Ten Charts that Prove the United States Is a Low-Tax Country, Center for American Progress.
U.S. corporate profits are at historic levels as companies experience strong growth overseas and cut costs in the domestic market. Booming profits and low tax rates have benefited companies tremendously with an estimate putting the cash pile they hold at over a $1 Trillion. Despite the huge cash pile, most companies have a low dividend payout ratio. The average yield on the S&P 500 is just around 2%. Due to lack of growth in the local market most companies avoid investing at home. As a result, the unemployment rate continues to be high and most government policies have failed to to stimulate economic growth.


