The Callan Periodic Table of Investment Returns for 2011 is shown below:
Click to enlarge

Source: Callan Associates
Some interesting observations noted by Callan include:
- The U.S. markets generated a tiny 2.11% return which is better than the double digit losses for the overseas developed and emerging markets.
- For only the third time in 13 years, small caps (-4.18%) trailed large caps (+2.11%) in 2011.
- With a return of 7.84% fixed income was the best performing asset class last year.
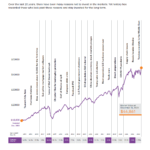
- In 2008 U.S. large cap stocks fell by 37%. The strong rallies of the S&P 500 in 2009 and 2010 were not enough to erase the losses of 2008. In addition, the lackluster performance in 2011 did not help the index get closer to the 2008 peak.
The Callan Charts for 2009 and 2010 can be found here and here.
Related ETFs:
iShares MSCI Emerging Markets ETF (EEM)
Vanguard Emerging Markets ETF (VWO)
SPDR S&P 500 ETF (SPY)
SPDR STOXX Europe 50 ETF (FEU)
SPDR DJ Euro STOXX 50 ETF (FEZ)
iShares iBoxx $ Investment Grade Corporate Bond Fund (LQD)
iShares Barclays US Aggregate Bond Fund(AGG)
Vanguard Total Bond Market ETF (BND)
Disclosure: No Positions
Related: The Callan Periodic Table of Investment Returns 2016: A Review