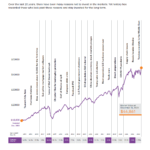
U.S. equities fared very poorly in the lost decade with the nominal S&P 500 stock price down 20% for the decade excluding dividends. The graphic below shows the performance of the S&P 500 index by decades:
Click to enlarge

Source: A lost decade for stocks. Will next one be better?, Christian Science Monitor
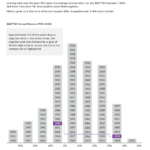
While U.S. stocks practically went nowhere in the past decade, fixed income investments performed extremely well in the period from 2001 thru 2010 as shown in the graphic below:
Click to enlarge

Source: JPMorgan Funds
For the 10-years, High yield bonds, Corporate bonds, TIPS and Munis returned 134.2%, 89.0%, 97.2% and 60.3% respectively.
The key takeaway from this post is that fixed-income should be part of a well-diversified portfolio.
Disclosure: No Positions